
Is Pump.fun a Good Buy at Current Prices?
PUMP has cleared both its 200-day and its 50-day average, yet it still trades well below its twelve-month high. We check with our own price data what argues for and against buying Pump.fun at the current price.





Which topics should we dive deeper into?
Select what genuinely interests you. Your picks feed directly into our editorial planning.
Crypto news that's actually worth your time.
Weekly. 60 seconds. Carefully curated by our editors: no hype, no promo flood, no spam.
Pump.fun (PUMP) changes hands at $0.004564 at the time of writing. That is roughly 47 percent below the twelve-month high of $0.008619 set on 16 September 2025, and almost four times the twelve-month low of $0.001196 from 26 June 2026. After a gain of 42 percent in seven days and 126 percent in thirty, the question facing anyone looking at the token today differs from the one that applied in June: is Pump.fun a good buy at current prices, or does the price already reflect what the platform delivers?
cryptoticker.io collected the price data behind this analysis on 27 August 2026. The source is market data from CoinMarketCap, retrieved through the numerical asset ID rather than the ticker, because the symbol PUMP is carried by several unrelated tokens. The method is standard: daily closing prices across 365 days, from which we calculated the 200-day and the 50-day exponential moving average, the 14-day relative strength index and the twelve-month extremes.
Pump.fun price analysis: where the PUMP price stands and which levels matter
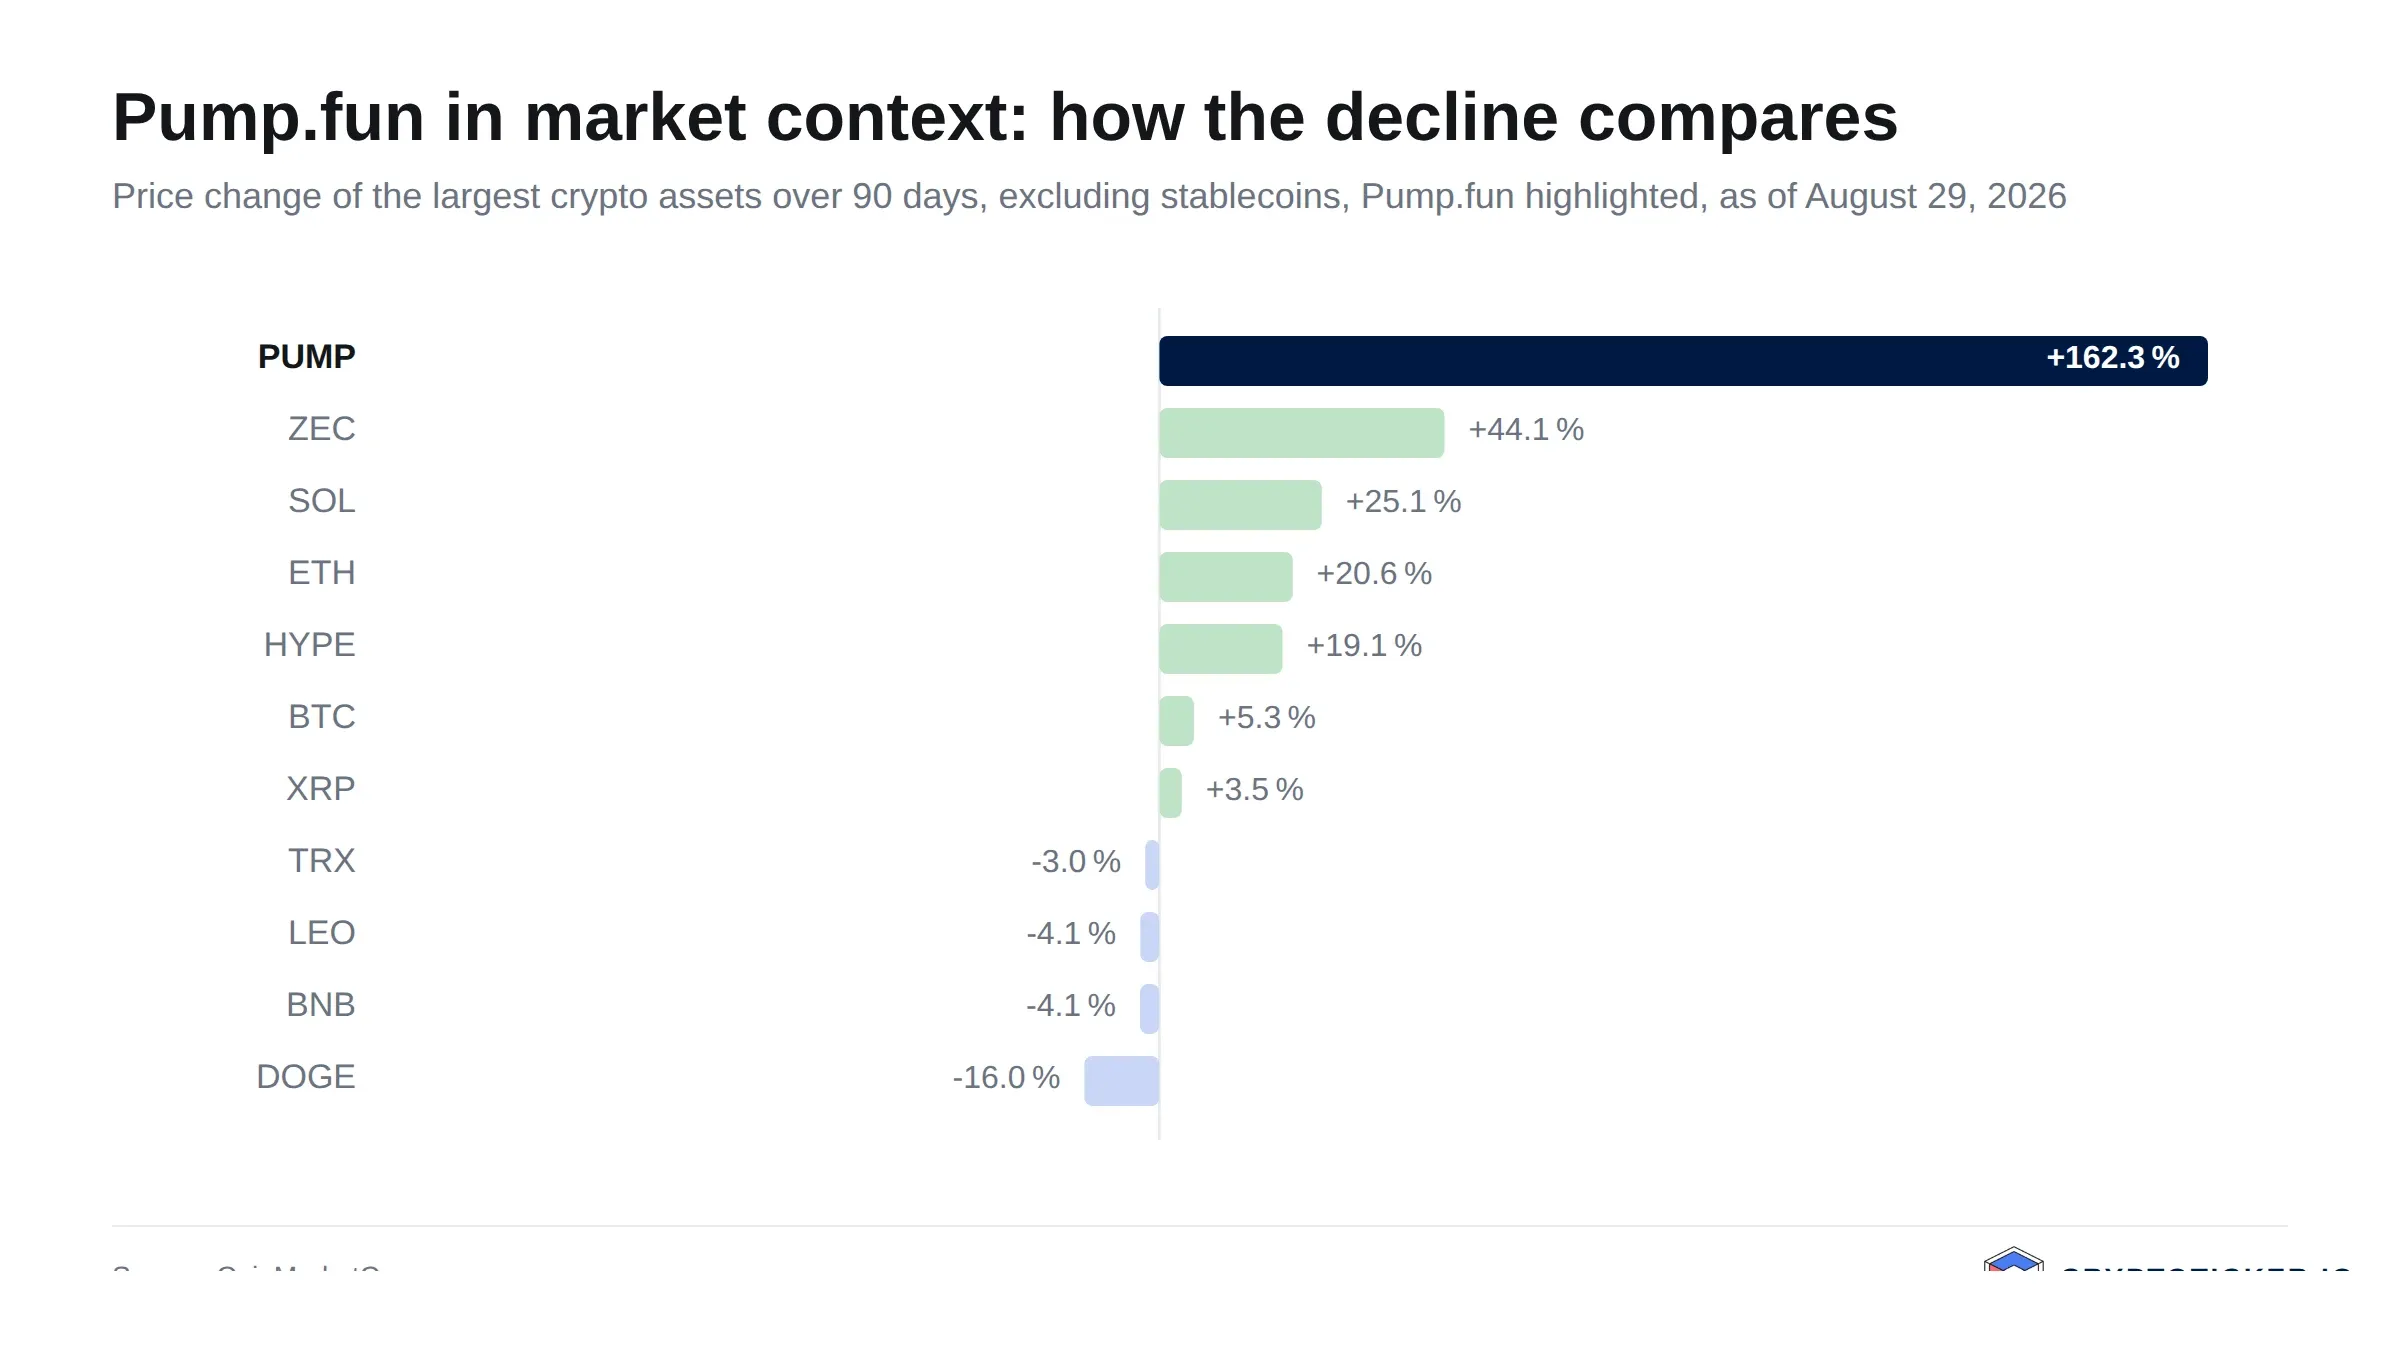
At $0.004564 the token holds a market capitalisation of about 1.81 billion dollars and ranks 42nd by that measure. Both averages that define the medium-term picture sit far below that quote: the 200-day average at $0.002349, the 50-day average at $0.002717. Price is therefore around 94 percent above its 200-day line and about 68 percent above its 50-day line, a configuration that says the advance has been rapid rather than gradual.
Three price zones organise the chart. The upper reference is the twelve-month high of $0.008619 from September 2025, still roughly 47 percent away. The current zone runs between the round $0.004 mark and the $0.005 area. Beneath that, the first structural floor is the 50-day average at $0.002717, and below it the 200-day average at $0.002349 marks the boundary of the trend that began at the June low of $0.001196.
The gap between the current quote and those two lines is the central fact of this analysis. A pullback that merely returns the token to its 50-day average would cost around 40 percent from today's level. That is arithmetic rather than forecast, and it defines the risk an entry at $0.004564 accepts.
Is the Pump.fun downtrend broken or only interrupted?
From the September 2025 high of $0.008619 to the June 2026 low of $0.001196, PUMP lost about 86 percent. Since that low the price has recovered roughly 282 percent, and over the full twelve months it stands about 57 percent higher than a year ago.
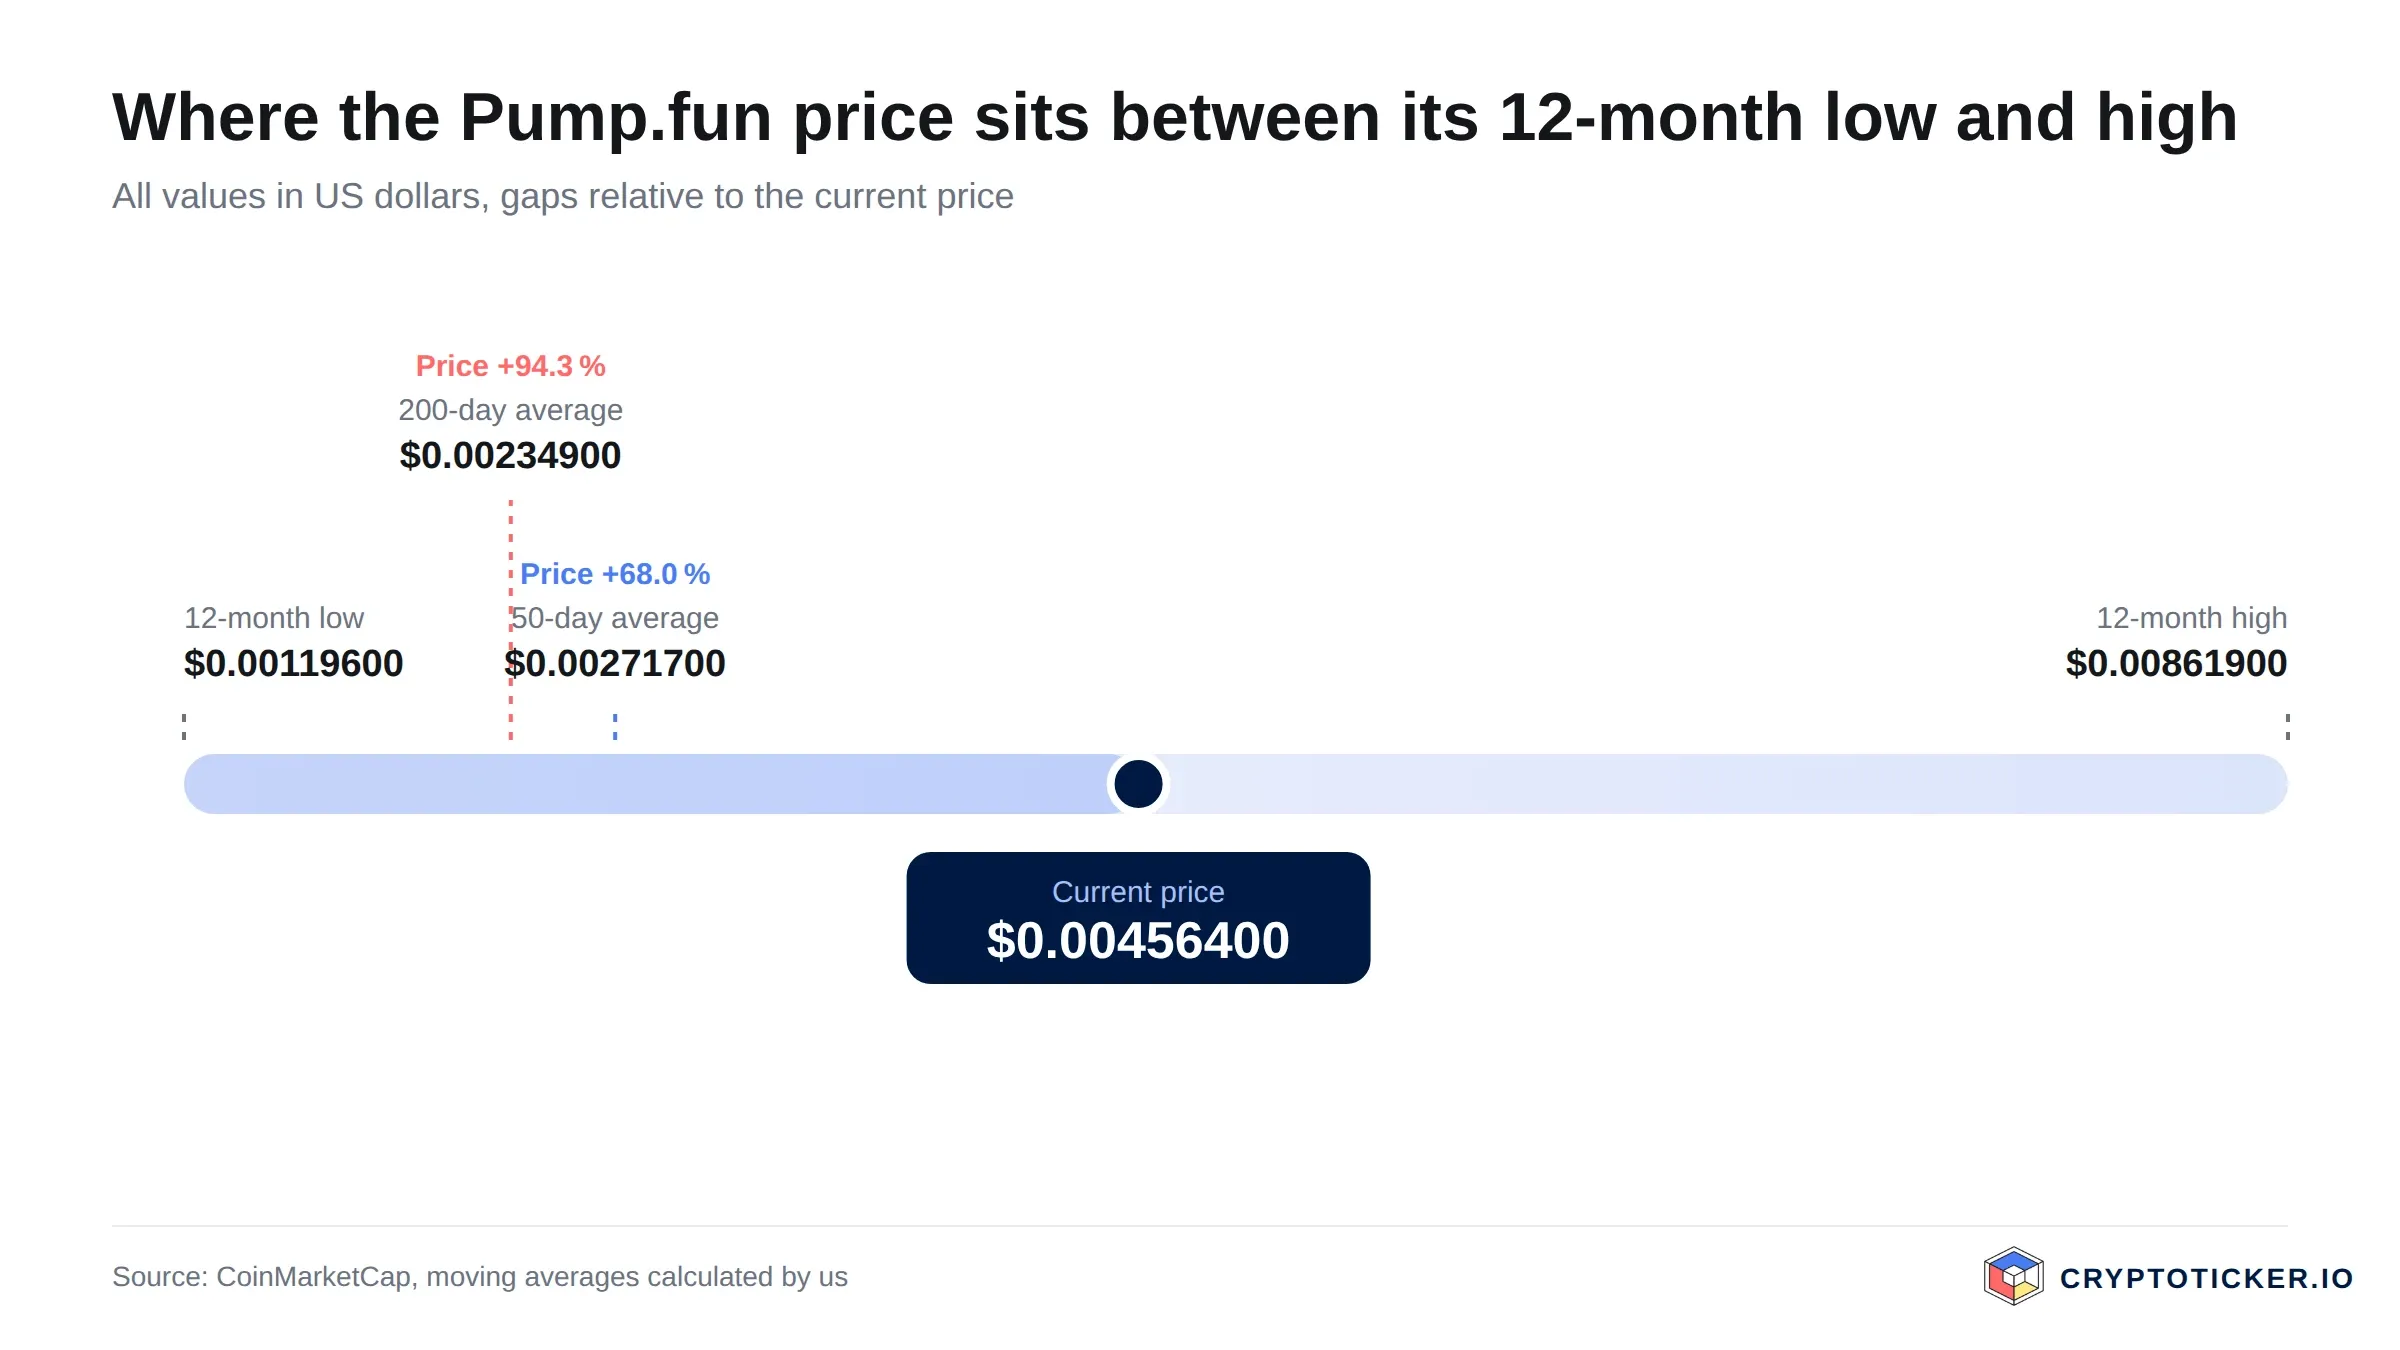
Technically, the downtrend is broken rather than merely interrupted. Price trades above both averages, and the 50-day average at $0.002717 sits above the 200-day average at $0.002349, the sequence trend followers read as a confirmed upward structure.
Two qualifications belong next to that reading. The token began trading in July 2025, so the entire data set covers a single market cycle. And a broken downtrend is a statement about direction rather than about valuation: the same chart that shows a recovery also shows a token that has moved 282 percent in nine weeks without a meaningful correction along the way.
What RSI and moving averages mean for a Pump.fun entry
The 14-day relative strength index stands at 70.2. Readings above 70 are conventionally called overbought, which does not mean a decline is due. It means recent daily gains have dominated recent daily losses to an unusual degree, and that new buyers are entering after the move rather than before it. In strong trends an RSI can remain elevated for weeks; what changes is the price paid for the same exposure.
The moving averages tell the same story in a different unit. An asset trading 94 percent above its 200-day line has stretched far from its own medium-term mean, and mean reversion in this segment tends to be abrupt rather than orderly. For a buyer, the practical consequence is the distance to the levels where support would first be tested: $0.002717 and, further down, $0.002349.
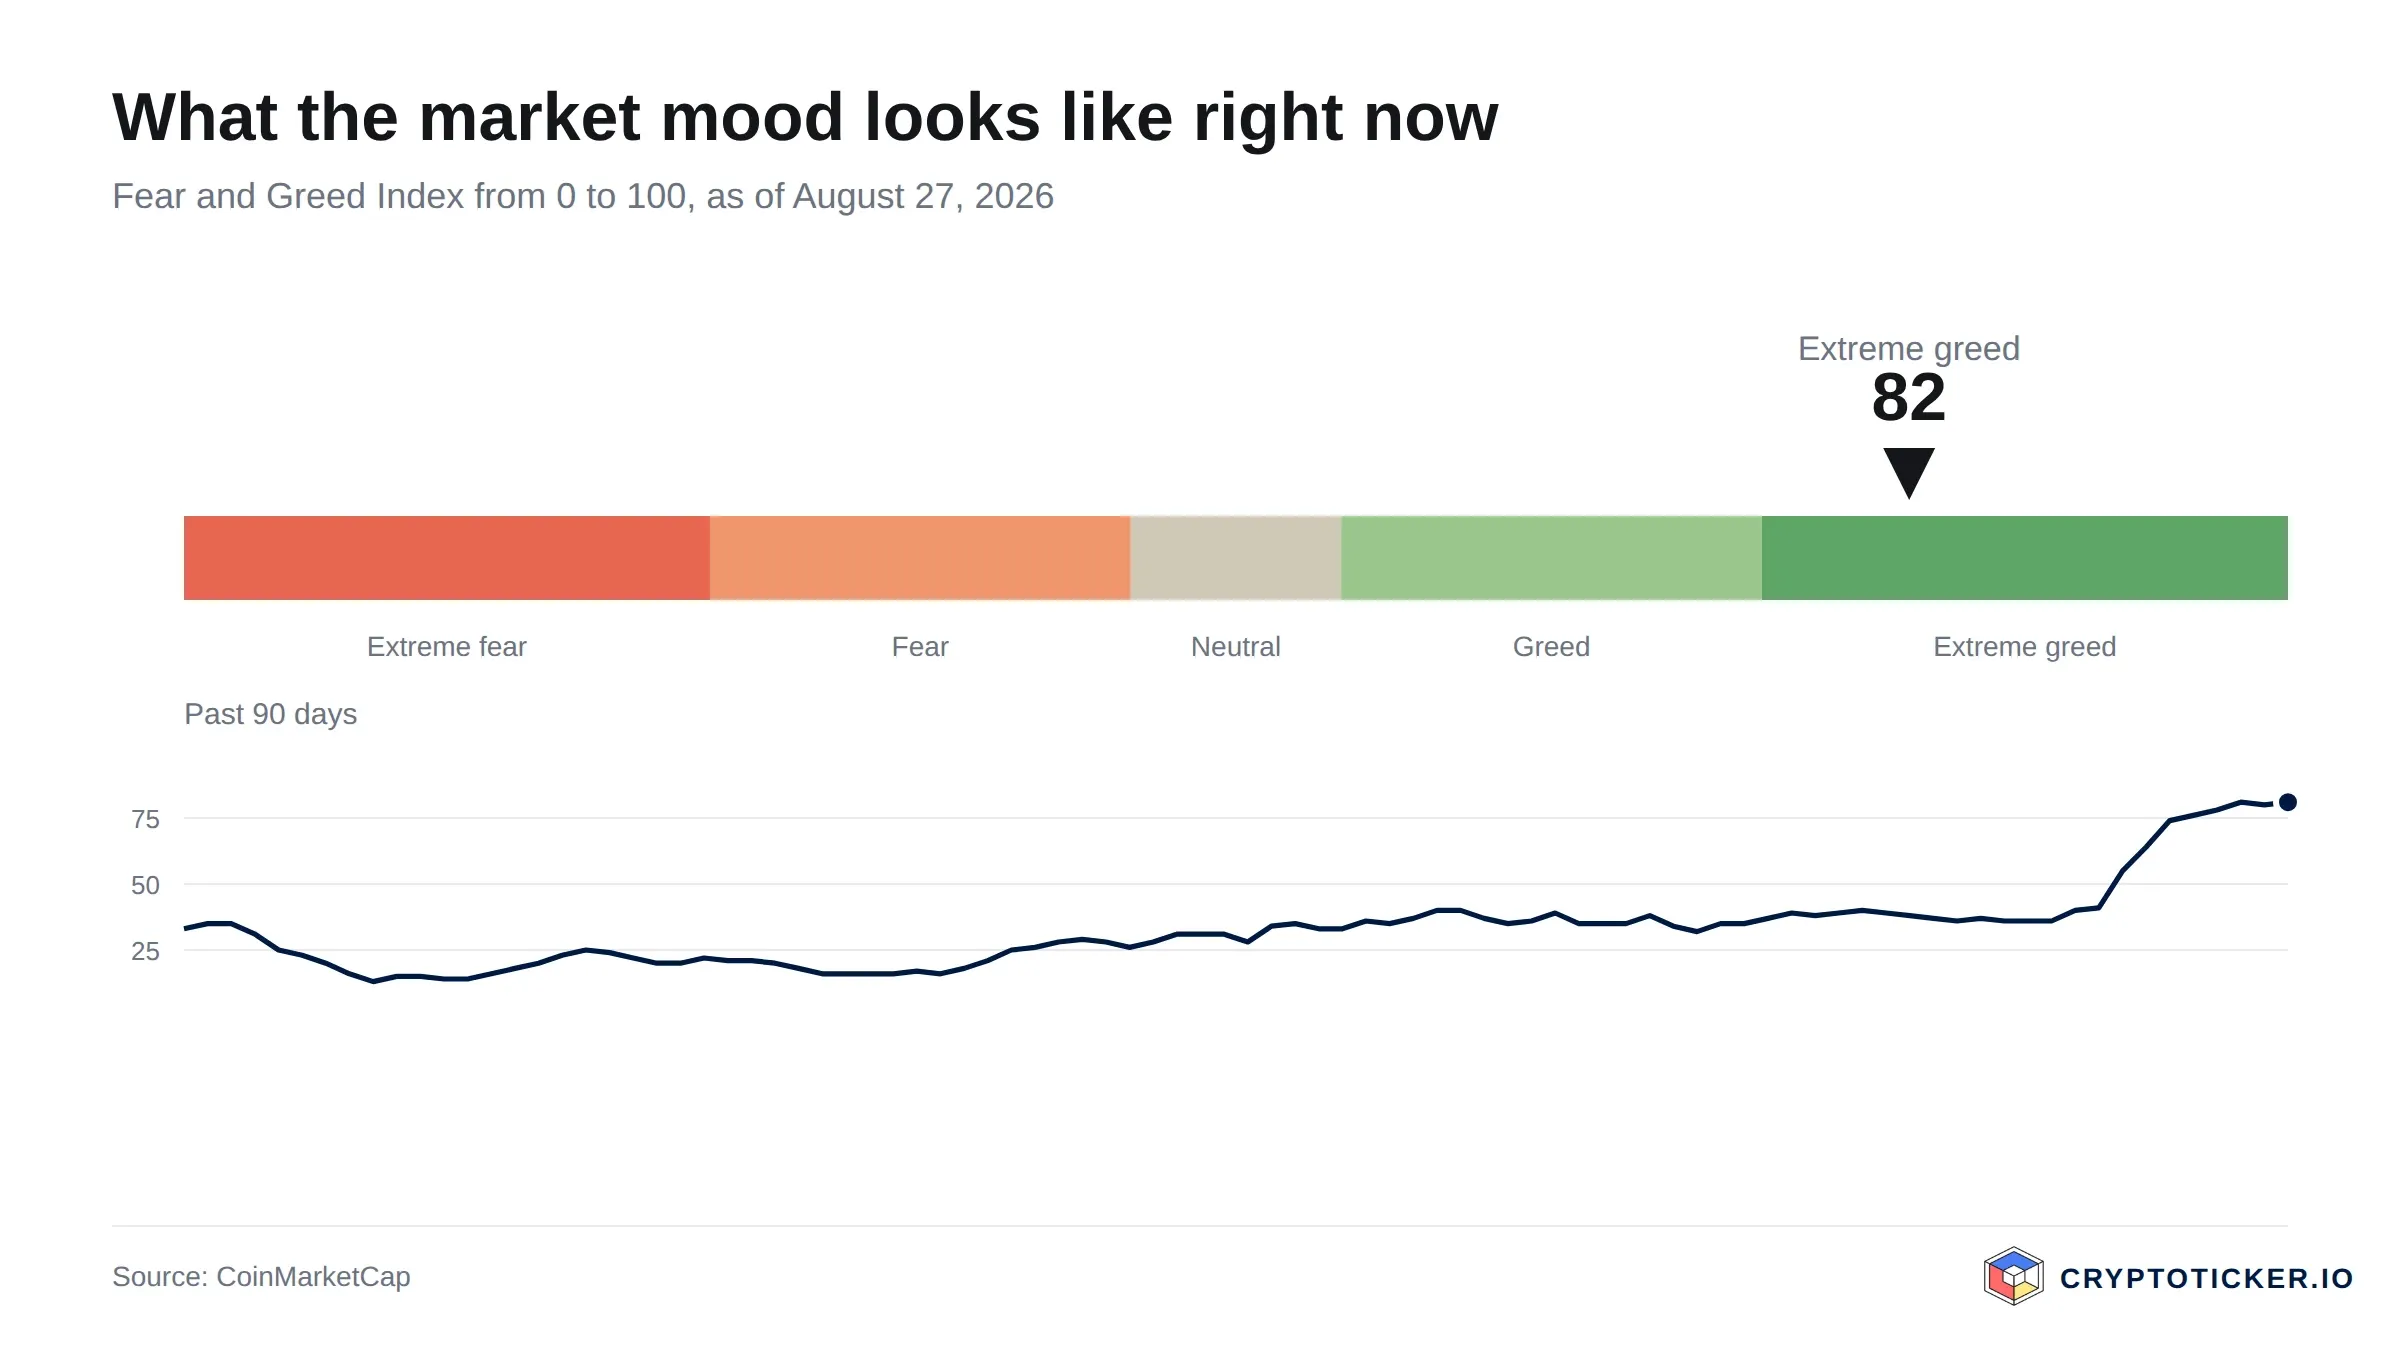
Broader sentiment points the same way. The CoinMarketCap Fear and Greed reading stood at 80 on 27 August 2026, in the extreme greed band, which says the market is positioned for continuation. Positioning of that kind has historically made pullbacks sharper when they arrive. The longer-dated view sits in our Pump.fun price prediction.
What trading volume reveals about Pump.fun demand
Turnover in PUMP amounts to about 288.5 million dollars over 24 hours, against a market capitalisation of roughly 1.81 billion dollars. Close to 16 percent of the float trading in a single day is high in absolute terms and typical for this segment.
The trend in volume matters more than the level. Average daily turnover over the past 30 days sits near 177.5 million dollars, while the 90-day average is about 105.2 million. Activity has expanded alongside the price, which is the pattern that gives a rally its confirmation. Advances on shrinking volume are the ones that tend to fail.
One detail argues for caution. Over the most recent 24 hours the token lost about 6 percent while turnover stayed above 288 million dollars. Falling prices on elevated volume are the signature of distribution, of holders selling into demand. A single day proves nothing, and it is worth watching whether the pattern repeats.
Which structural factors speak for Pump.fun: supply mechanics, usage and regulation
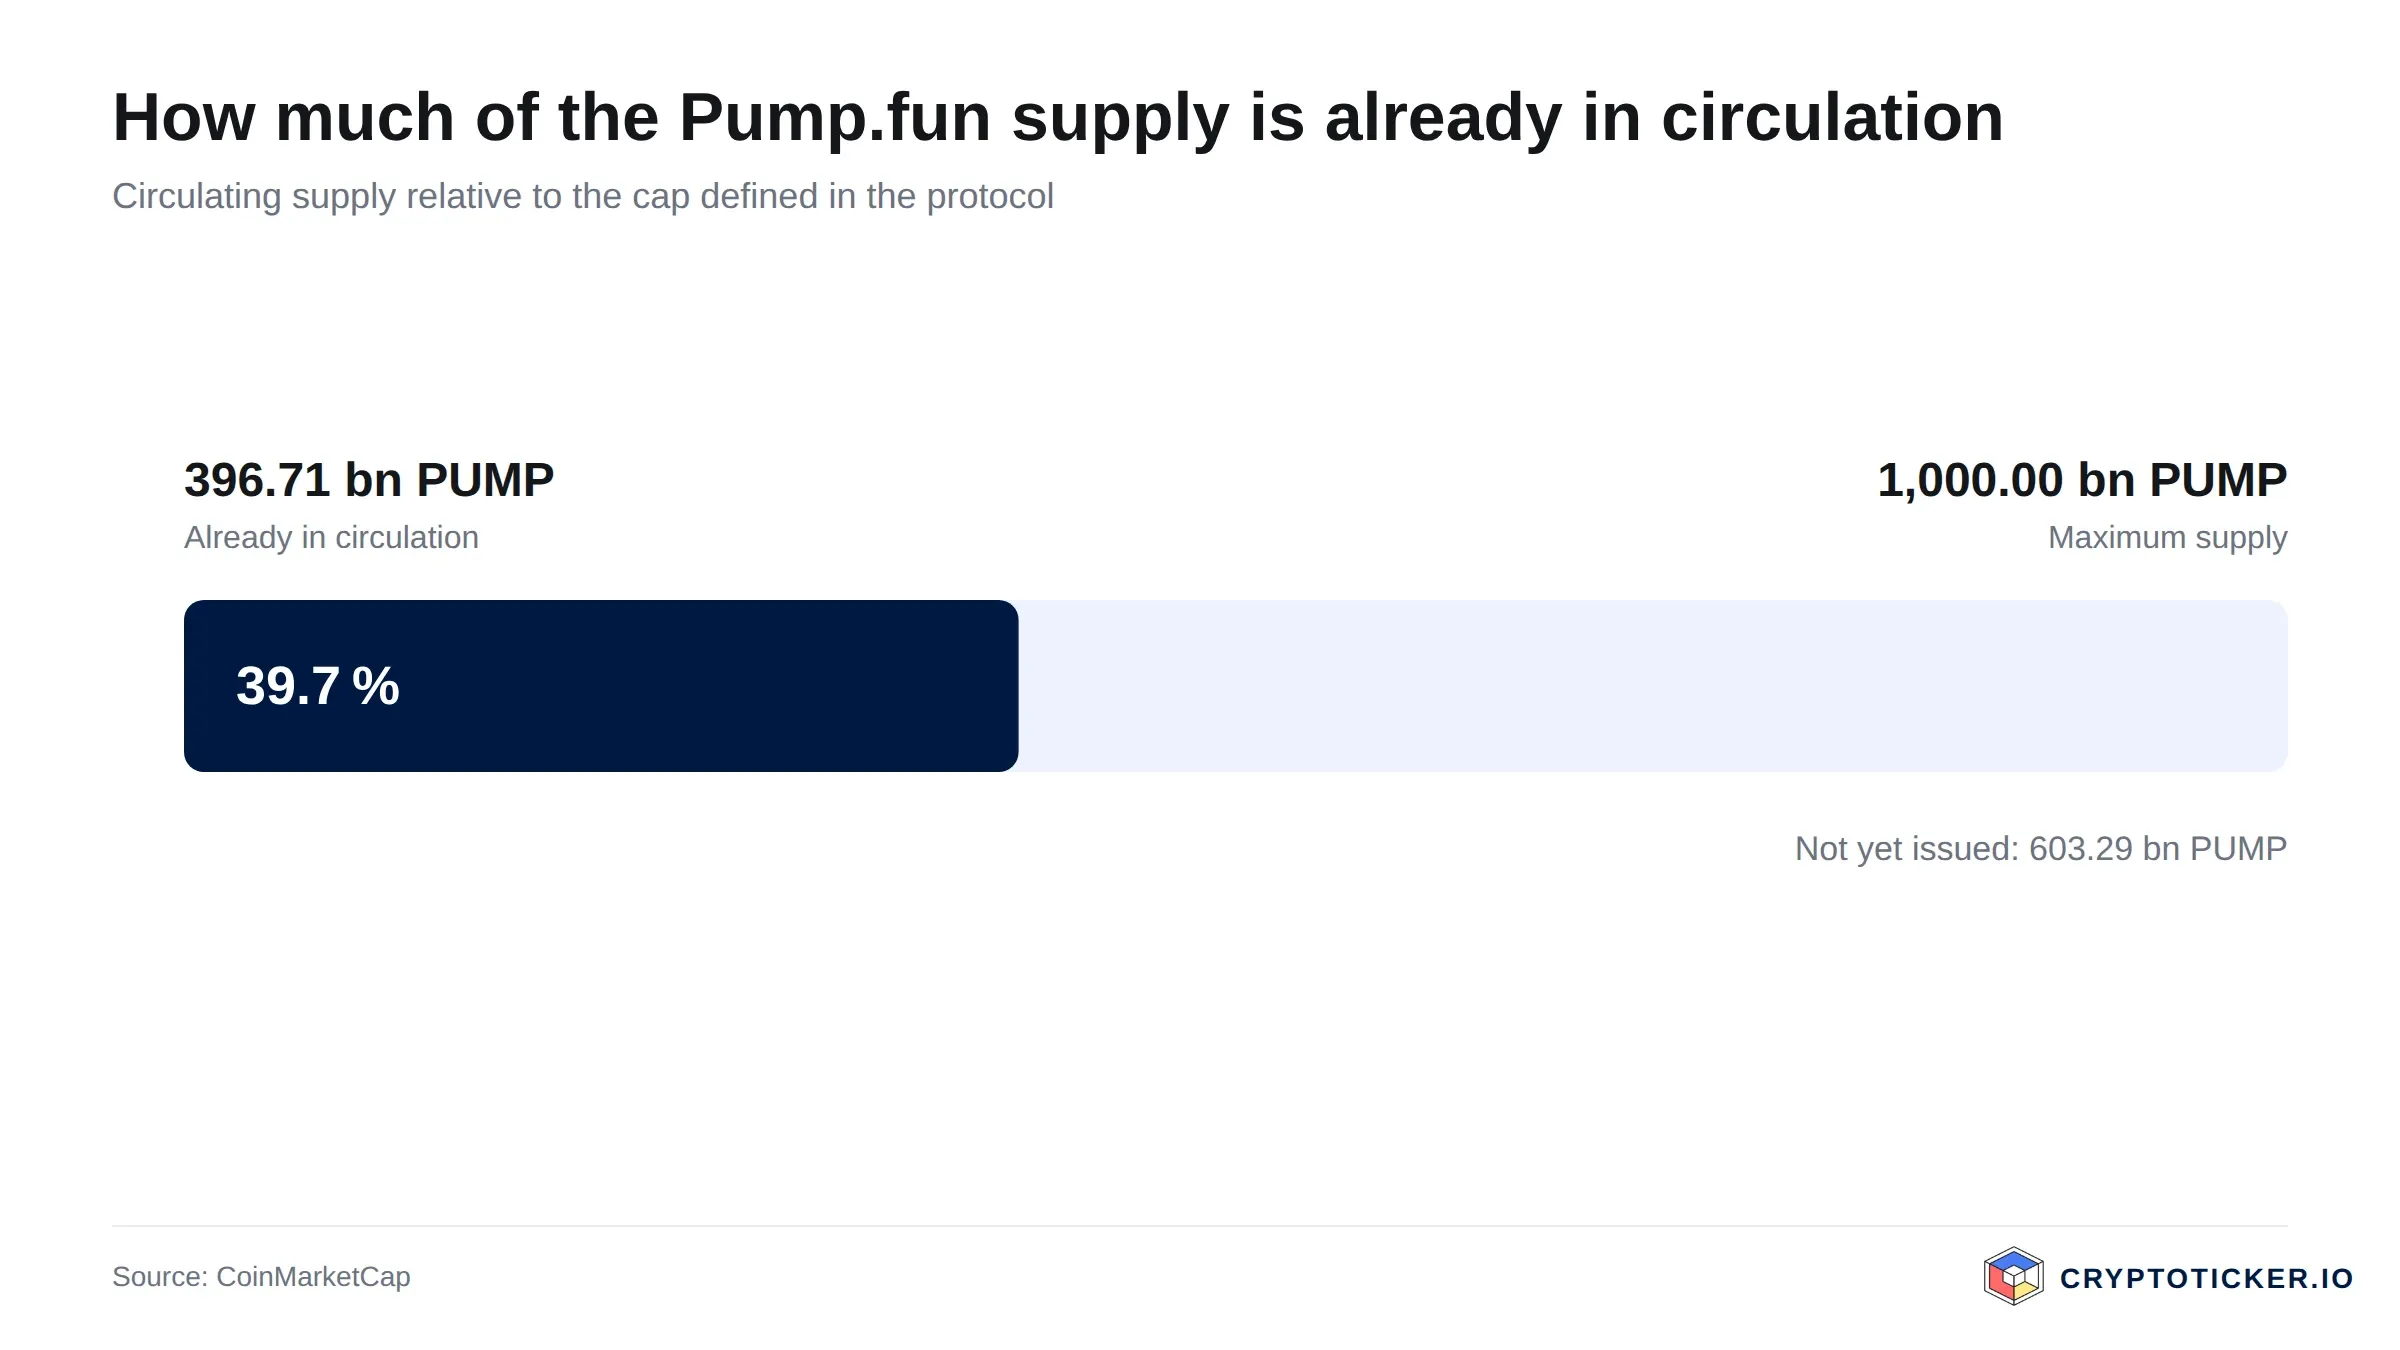
Supply is the first structural fact, and it cuts both ways. Of a maximum supply of 1,000,000,000,000 tokens, about 397,291,627,668 circulate today, close to 40 percent. Every market capitalisation figure quoted for PUMP therefore describes a minority of the eventual float, and the tokens still outside circulation are a supply overhang that a rising price does nothing to remove.
Usage is the second. Pump.fun operates as a token launch platform on Solana, and its revenue comes from fees charged on token creation and on trading activity across the platform. That gives the token an anchor that pure memecoins lack: platform activity is measurable, and it rises and falls with speculative appetite across the Solana ecosystem. It also makes PUMP a leveraged expression of that appetite rather than an independent one. The infrastructure it depends on is documented in the Solana developer documentation.
Regulation is the third. In the European Union, crypto asset service providers operate under the MiCA framework, and the classification of platform tokens carrying fee-linked value remains an area of active supervisory attention. The European Securities and Markets Authority publishes its guidance for the sector, and anyone building a position of size should follow that work rather than assume the status quo persists.
What speaks for buying PUMP at current prices
The first argument is trend structure. Price sits above both the 200-day average at $0.002349 and the 50-day average at $0.002717, with the shorter line above the longer one. Buyers who work with trend confirmation rather than with bottom fishing have their signal.
The second is the volume backing. A 42 percent weekly advance carried by turnover well above its own 90-day average of roughly 105.2 million dollars per day is better supported than a move on thin trading, and that depth lowers the cost of building or exiting a position.
The third is the distance to the record. At $0.004564 the token remains about 47 percent below its twelve-month high of $0.008619. For anyone who accepts the platform's revenue model as durable, that gap is the part of the case that has not yet been closed by the rally.
What speaks against buying Pump.fun at current prices
The first counterargument is the extension itself. Buying at $0.004564 means paying 94 percent above the 200-day average and 68 percent above the 50-day average, and accepting that a routine return to the shorter line would take roughly 40 percent off the position. An RSI of 70.2 says that entry happens after the crowd, not ahead of it.
The second is the supply overhang. With around 397,291,627,668 of 1,000,000,000,000 tokens in circulation, roughly 60 percent of the eventual supply has yet to reach the market. Tokens that enter circulation later meet whatever demand exists at that moment, and schedules of this kind have repeatedly capped recoveries in comparable assets.
The third is the thinness of the record. The price history covers a single cycle, from the July 2025 launch through the September 2025 high of $0.008619, the June 2026 low of $0.001196 and the current recovery. There is no second cycle against which to test how platform revenue behaves when speculative activity contracts for a prolonged period, and the concentration of that revenue in one ecosystem is a risk no chart displays.
How to buy Pump.fun (PUMP) at the current price: costs, custody and providers
PUMP is listed on a smaller set of venues than the large caps, so the first practical step is checking availability rather than fees. Where the token is offered, the cost consists of the trading fee, typically between 0.1 and 1.5 percent depending on venue and order type, and the spread, which in less liquid pairs frequently exceeds the visible fee. Limit orders are the standard defence against the second cost. Our exchange comparison sets the fee models side by side, and the reports on Kraken and Bitvavo cover deposit routes and account requirements.
Custody is the second decision. Positions held for months belong in wallets whose keys the holder controls, and the options are compared in our hardware wallet comparison. Leaving the token on the venue substitutes counterparty risk for key-management risk. For derivative exposure, our comparison of perpetual DEX platforms is the relevant reference.
Position sizing is the third. A token that has moved 282 percent in nine weeks and lost 86 percent in the nine months before belongs, if at all, in the part of a portfolio whose complete loss would not change the plan.
Is Pump.fun a good buy at current prices, short term and long term
Short term, the picture is a strong trend at a stretched price. Momentum, volume and sentiment point the same way, while an RSI of 70.2 together with a 94 percent premium over the 200-day average describes an entry with limited margin for error. The nearest reference for a failed continuation is the 50-day average at $0.002717.
Long term, the case rests on a question no chart answers: whether fee revenue from token launches on Solana proves durable across a full cycle rather than only in a phase of high speculative activity. If it does, the 47 percent discount to the twelve-month high of $0.008619 is the relevant framing. If it does not, the June low of $0.001196 shows what this token does when that activity dries up.
This is an assessment, not a recommendation, and it can be falsified. The constructive reading would be wrong if the price closed back below the 200-day average at $0.002349, if daily turnover fell durably beneath the 90-day average of about 105.2 million dollars while the price held, or if further supply entering circulation coincided with a persistent decline in platform activity. The cautious reading would be wrong if the token consolidated above the $0.004 area for several weeks while volume stayed elevated, letting the averages close the gap from below rather than the price closing it from above.
Buying Pump.fun (PUMP): What to Take Away
- At $0.004564 the token trades far above both of its averages and about 47 percent below its twelve-month high, so the entry pays for a trend that is already established. The longer-dated view sits in our Pump.fun price prediction.
- The supply schedule matters more than the chart: roughly 60 percent of the maximum supply has yet to circulate, which is the structural difference between this token and the large caps examined in our analysis of whether Bitcoin is a good buy at current prices.
- PUMP is a leveraged expression of speculative activity on Solana, so the ecosystem view belongs with the token view, as set out in our assessment of whether Solana is a good buy at current prices.
Disclosure: Some of the providers mentioned in this article work with us through partner programmes. This has no influence on the price analysis or on the assessment of the chart situation; the price data comes from a public market data source and can be verified there.
(Last updated: 27 August 2026. This article is not investment advice. Prices, fees and terms change; check them with the provider before every purchase. Crypto assets are subject to high price volatility and a total loss is possible.)
Transparency note: This article was produced with the assistance of artificial intelligence and reviewed by our editorial team before publication. All figures and claims were checked against the primary sources linked in the text. The feature image was generated with AI.
Related articles
Which topics should we dive deeper into?
Select what genuinely interests you. Your picks feed directly into our editorial planning.
Crypto news that's actually worth your time.
Weekly. 60 seconds. Carefully curated by our editors: no hype, no promo flood, no spam.

August 23, 2026 2:21 PM

Is Hyperliquid a Good Buy at Current Prices?
HYPE set its twelve-month high in September and has given part of it back, with the RSI now neutral. We weigh chart, RSI, trading volume and supply mechanics to see what argues for and against buying Hyperliquid at current prices.
August 11, 2026 5:35 PM

Is Ethereum a Good Buy at Current Prices?
Ethereum has fallen further than Bitcoin and recovered better of late. What chart structure, the fee mechanism and trading volume say about buying at current prices.
August 11, 2026 5:35 PM

Is Bitcoin a Good Buy at Current Prices?
Bitcoin trades about a third below its twelve-month high and has reclaimed both moving averages. What chart structure, RSI and trading volume say about buying at current prices.
June 18, 2026 10:57 PM
Is Solana (SOL) a Good Buy at Current Prices?
Solana has traded above its 200-day average since August, the 50-day average joined it on 21 September, and volume is now keeping pace. What chart structure, issuance and tokenisation say about buying at current prices.

September 23, 2024 8:44 AM
Is it a Good Idea to Buy XRP below $0.60?
With recent XRP price drops positioning it below the $0.60 mark, investors are left pondering. Is it a good idea to buy XRP below $0.60?

April 24, 2026 3:29 PM
XRP Price Prediction: Why Ripple is Stuck in a Sideways Grind
XRP price remains stagnant despite regulatory wins. This XRP price prediction analyzes the technical chart and identifies the key breakout levels for 2026.
July 22, 2025 9:28 AM
XRP Price Prediction: Is Now the Right Time to Buy XRP After the Dip?
XRP price pulled back -2.6% in the last 24 hours following a sharp +22% weekly surge. Should you buy the dip or wait for a better entry?

October 1, 2026 4:13 AM

Pump.fun (PUMP): A Sixth of All Tokens Burned, Price Up 50 Percent in a Week
Pump.fun has now destroyed almost 17 percent of its maximum supply, and the PUMP price rose by half in seven days. On top of that came a clarification from the US Securities and Exchange Commission on buyback programs that frees up less than many headlines claim. Here are the week's figures, the levels and what investors in Germany should check.
July 7, 2024 3:21 PM
XRP, DOGE, and ADA Price Prediction: A Fast Recovery BUT How Long Lasting?
The potential turnaround for XRP, Dogecoin, and Cardano as key metrics indicates a buying opportunity amidst the current market downturn. Here is the latest XRP, DOGE, and ADA price prediction and analysis for a better understanding.
April 6, 2026 6:24 PM
Ethereum Price Analysis: ETH Consolidates Between $1,800 and $2,100, What’s Next?
Ethereum price is stuck in a tight range between $1,800 and $2,100. Analysts warn of a decisive breakout or breakdown as volatility reaches a boiling point.
July 21, 2025 5:00 AM

Cardano Price Prediction: ADA Finally Wakes Up After Bitcoin ATH
Cardano has been lagging — until now. While Bitcoin topped out weeks ago, ADA is just starting to move. What’s next for the ADA price?
September 28, 2026 4:28 AM

Is Quant a Good Buy at the Current Price?
Quant has broken out sharply after a mandate in US payments and stands at its highest level in twelve months. Is QNT a good buy at the current price? We examine the chart situation, volume and supply mechanics with our own data.
September 20, 2026 9:21 AM

Is Ethena a Good Buy at Current Prices?
Ethena has rebounded hard off its twelve-month low and still trades far below its high. Is ENA a good buy at current prices? We check the chart, the supply schedule and the source of the yield with our own price data.
March 12, 2026 2:52 PM
Ethereum Price Stabilizes Above $1,900: Is the Path to $3,000 Now Clear?
Ethereum price shows resilience above $1,900. Analyzing on-chain data and technical charts suggests a potential recovery toward the $3,000 psychological level.
January 26, 2026 10:50 AM

Bitcoin Price Prediction: BTC Breaches $88K Support and Faces Potential Downside
Bitcoin has dropped below the critical $88,000 support level on January 26, 2026. Market indicators suggest a risk of further declines amid global macro uncertainty.
August 27, 2026 6:23 AM

Is Bittensor a Good Buy at Current Prices?
Bittensor has pulled well clear of its twelve-month low but keeps running into its 200-day average. We check what our own calculations from 365 daily closing prices say about buying TAO at current prices.
August 27, 2026 4:31 AM

Is AAVE a Good Buy at Current Prices?
AAVE has worked its way back above both the 200-day and the 50-day moving average, yet still trades far below its twelve-month high. Using our own price data, we examine what speaks for and against an entry at current prices.
August 27, 2026 3:39 AM

Is Cronos a Good Buy at Current Prices?
Cronos has reclaimed its 200-day line for the first time since the spring, and the RSI is back out of overbought. We weigh what speaks for and against buying CRO at the current price.
August 27, 2026 3:24 AM
Is Hedera a Good Buy at Current Prices?
HBAR has bounced off its twelve-month low but still trades well below its long-term average. We weigh moving averages, RSI and volume to judge whether Hedera is a good buy at the current price.
August 26, 2026 4:21 AM

Is Uniswap a Good Buy at Current Prices?
Uniswap has cleared both of its main moving averages for the first time in months, yet momentum readings are running hot. We weigh what speaks for and against buying UNI at the current price, using our own calculations.
August 16, 2026 12:21 PM

Is Toncoin a Good Buy at Current Prices?
Toncoin has reclaimed both of its moving averages and now goes by the name Gram. We weigh what the chart, the RSI and the recovery in trading volume say for and against buying at current prices.
February 25, 2026 7:00 PM
Bitcoin Price Analysis: Why Did BTC Coin Pump to $69,500 Today?
Bitcoin price surges toward $70,000 following a short squeeze and positive macro sentiment from the State of the Union address.
April 10, 2022 1:17 PM

IOTA Price is about to POP 10%! BUY IOTA?
IOTA price today is seeking to make higher highs. With the current technicals in place, this seems very plausible. Is IOTA up soon?
August 23, 2026 1:16 AM

Is PEPE a Good Buy at the Current Price?
PEPE is back above both moving averages and the 50-day has crossed the 200-day. Is the memecoin a good buy at the current price, or is the rally already running on thin volume?
August 13, 2026 8:19 AM
SpaceX Stock Up 40% in 5 Days: SPCX Adds $530 Billion as Musk Bets the Company on AI
SPCX has ripped 40% higher in five sessions, adding roughly $530 billion in market value. Here is what is driving it and what the chart says next.
More from CryptoTicker