
Is Quant a Good Buy at the Current Price?
Quant has broken out sharply after a mandate in US payments and stands at its highest level in twelve months. Is QNT a good buy at the current price? We examine the chart situation, volume and supply mechanics with our own data.





Which topics should we dive deeper into?
Select what genuinely interests you. Your picks feed directly into our editorial planning.
Crypto news that's actually worth your time.
Weekly. 60 seconds. Carefully curated by our editors: no hype, no promo flood, no spam.
Quant (QNT) is quoted at $224.13 late on Sunday, September 27, 2026, which puts it at its highest level in twelve months. The previous twelve-month high of $106.64 from October 3, 2025 has been passed, and the twelve-month low of $55.87 dates from August 19, 2026. Over 24 hours the price has gained 82.5 percent, and over seven days 249.2 percent. The question at issue here: is Quant a good buy at the current price?
The price swung by several percent per quarter of an hour that evening, so the distances to the longer-term levels carry more weight.
cryptoticker.io collected the price data itself on September 27, 2026, from CoinMarketCap market data. The basis of calculation is the daily closing prices of the past twelve months together with the running price as the final data point; the moving averages follow the standard exponential formula, and the relative strength index the standard period of 14 days.
Quant price analysis: where the QNT price stands now
The current price of $224.13 is at the same time the twelve-month high and sits far above every level that governed trading over the past twelve months. The 200-day average stands at $68.96 and the 50-day average at $66.43. The price is therefore 225 percent above the 200-day level and 237 percent above the 50-day level. A distance of that kind describes a market that has detached from its own average within a handful of trading days.
Three zones matter for placing this. The area around the previous twelve-month high of $106.64, for a year the ceiling of trading and, on a setback, the first serious zone of support. The range between $66 and $69, where the two moving averages run almost on top of each other. And the twelve-month low of $55.87.
In between there is no established trading area. The stretch from around $105 to over $220 arose in a few days, and in that process no price levels form that many market participants later orient themselves by. Little there slows a decline.
Is the downtrend in Quant broken or only interrupted?
On a one-year view, Quant looked like a downtrend until a few days ago. On September 27, 2025 the price stood at $95.57, and on September 26, 2026 at $98.65, a gain of 3.2 percent over a year with the fall to $55.87 in August in between. Over 30 days there is now a gain of 267.1 percent, and over 90 days one of 241.1 percent.
In chart terms the downtrend is broken: the price has cleared the twelve-month high, and both moving averages sit below it. The only open point is whether the break lasts.
There is a testable yardstick for that. A trend change counts as confirmed when the price stays above the zone it broke through after the first setback, here above $106.64. If it falls back into the area of the moving averages, the move was a reaction to news inside an intact downtrend. That cannot be decided today, because the setback is still to come.
What the RSI and moving averages mean for a Quant entry
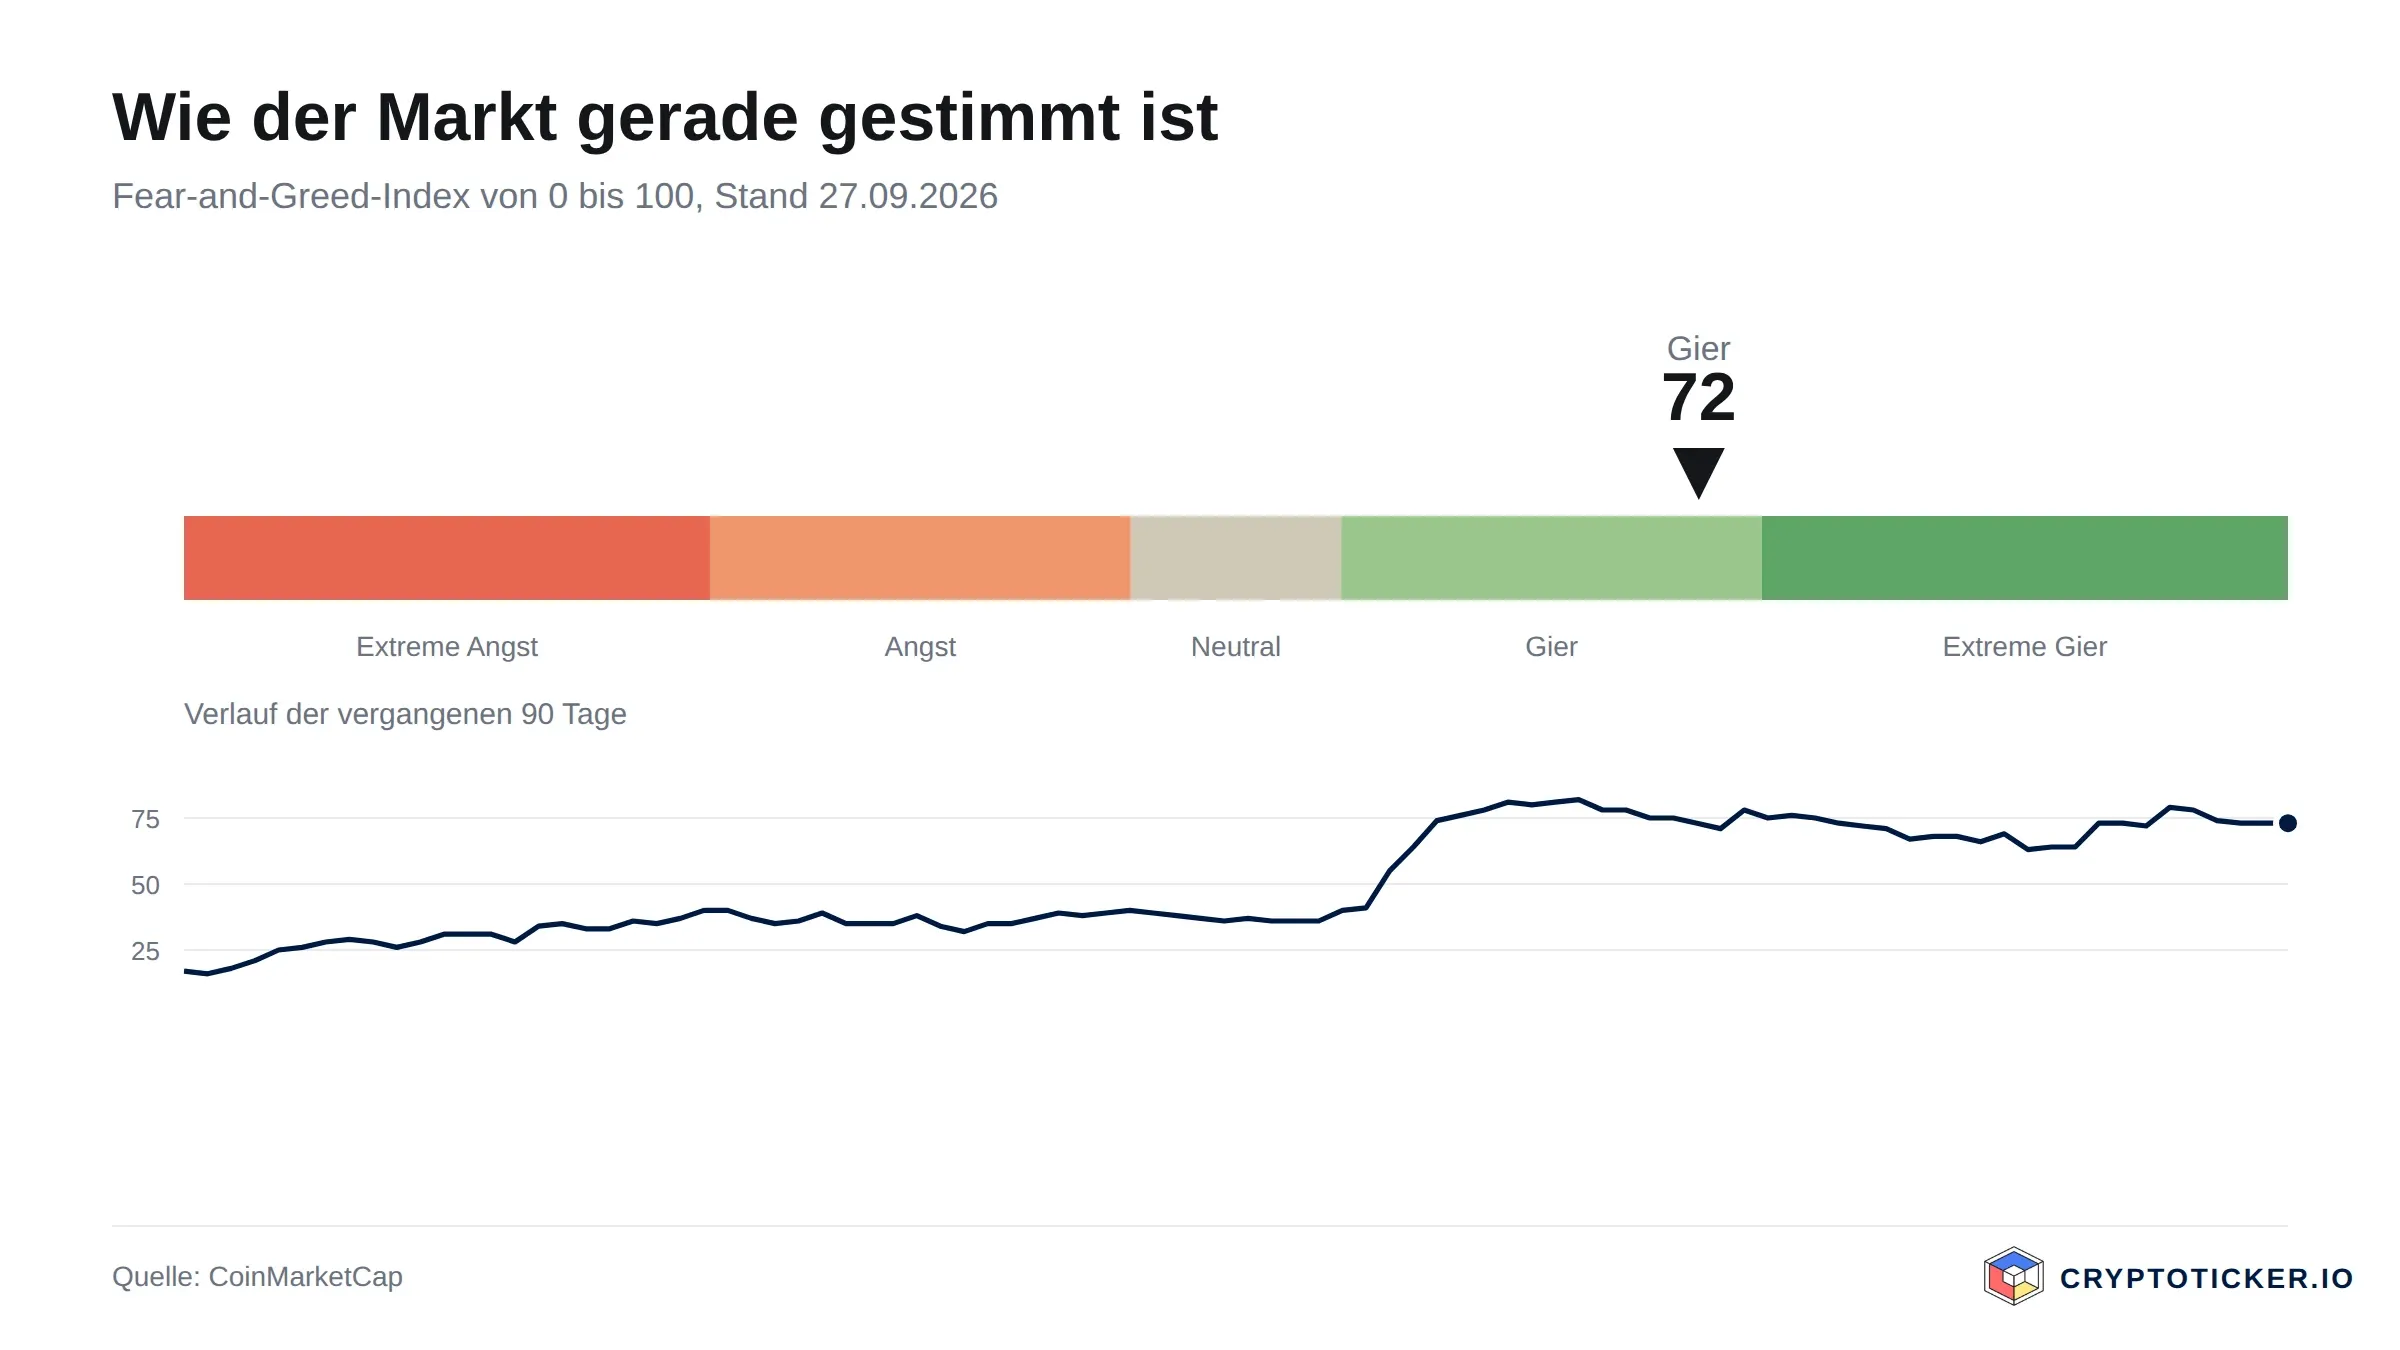
The relative strength index over 14 days stands at 95.0. The indicator is normalised to a range of 0 to 100, and readings above 70 count as overbought. A reading of 95 sits at the upper edge of what is possible and means that the past 14 trading days brought almost nothing but upward moves.
Two things follow from that. First, an extreme RSI says nothing about the direction of the next move; in strong trends the indicator often stays above 70 for weeks. Second, it shifts the relationship between opportunity and risk: anyone buying at the current price pays 225 percent above the 200-day average and carries the risk that this distance narrows.
That convergence can happen in two ways. The price falls, or it stands still for weeks while the average catches up. Which of the two occurs is open. The only certainty is that a distance of this magnitude has historically not lasted.
What trading volume reveals about demand for QNT
Trading volume over the past 24 hours comes to $777.5 million, against around $10.6 million on average over the past 30 days and around $8.8 million over 90 days. That is more than seventy times the monthly average.
More telling is the ratio of volume to market capitalisation: at $2.71 billion, that gives a turnover factor of 0.29, where a day earlier it stood at 0.04.
The jump is first of all a sign of genuine demand, because a price move without volume rarely holds up. It has a second side: peaks of this kind typically arise from news buying, short-term trading strategies and the covering of short positions. Only once volume recedes does it become apparent which part of the demand stays.
Market depth comes on top of that. An asset with around $10 million in daily turnover in normal operation has a thin order book, in which individual larger orders move the price noticeably in both directions. Anyone wanting to build or unwind a larger position compares the terms of the trading venues for it, for instance through the comparison of the best crypto exchanges.
Which structural factors speak for Quant
The trigger of the move is well documented. The Clearing House, the operator of the RTP and CHIPS payment systems owned by large US banks, selected Quant on September 24, 2026 as technology partner for its On-Chain Money Initiative. According to the announcement, Quant supplies the layer for interoperability and transaction management of a network over which financial institutions can settle tokenised deposits. The project is backed by 25 of the country's largest financial institutions and is due to be available in the first half of 2027. The detailed assessment is in our article on Quant and tokenised deposits.
Technically, behind this stands Overledger, Quant's enterprise platform, which connects public and private blockchains with classic banking systems. Since March 2026 there has also been a collaboration with the software house Murex, whose platform runs in the trading and post-trade settlement of many banks. That describes a position which connects to existing regulated systems instead of replacing them.
On the supply side the mechanics are favourable. Of a maximum of 14,881,364 QNT, 12,072,738 are in circulation, which is 81.1 percent, and the difference between a market capitalisation of $2.71 billion and a fully diluted valuation of $3.34 billion stays small. No large unlock wave is pending.
One point remains open, and it is the most important one. The contracts are signed by the company Quant, so revenue from software arises with the company in the first place. Whether the QNT token participates in that economically does not emerge from the announcements reviewed. Anyone who assumes such a connection should find it documented in the technical documentation before pricing it in. The European supervisory framework is documented by the securities regulator ESMA.
What speaks for buying Quant at the current price
First, the trigger is verifiable and has a date. Selection by the operator of the large US payment systems, with a target date in the first half of 2027, is more than a declaration of intent. Anyone who expects bank deposits to be tokenised is buying a provider with a documented mandate.
Second, the supply mechanics are straightforward. With 81.1 percent in circulation, the structural selling pressure that limits every recovery in many younger projects is absent.
Third, the chart finding is unambiguous. The price has cleared the twelve-month high, both moving averages sit below it, and the breakout is carried by extraordinary volume.
What speaks against buying Quant at the current price
First, the price you buy at today is already the result of the news. A gain of 249.2 percent in seven days means the market has processed the September 24 announcement. Anyone entering now is buying the expectation of what follows.
Second, the distance to the longer-term levels is extreme. Being 225 percent above the 200-day average and an RSI of 95.0 describe a state that historically unwinds, and below it there is no established trading area down to $106.64.
Third, the economic link between the business and the token is not documented. Until the launch in the first half of 2027, the valuation rests on an expectation alone, and that expectation cannot be tested against figures.
How you can buy Quant at the current price
QNT is listed on the larger European trading venues. For investors in the EU, the providers that matter are above all those falling under the European crypto regulation; the comparison of the best regulated crypto exchanges gives an overview.
Three items count when it comes to costs. The trading fee is mostly between 0.1 and 1.5 percent depending on provider and order type. Added to that is the trading spread between bid and ask, which comes out considerably wider in volatile phases with a thin order book, and finally deposit and withdrawal fees. How that adds up is shown by our reviews of Bitpanda and Kraken.
On execution in a phase like this one: a market order runs at the next best available price, which in fast moves departs noticeably from the one displayed. A limit order fixes the maximum price you are prepared to pay.
On custody: holdings left on the exchange stay in someone else's keeping. Anyone planning larger amounts or longer holding periods keeps custody themselves; the device options are covered by the hardware wallet comparison.
So, is Quant a good buy at the current price?
In the short run, over days to a few weeks, the price of $224.13 is an unfavourable entry point. An RSI of 95.0, a distance of 225 percent to the 200-day average and a gain of 82.5 percent in one day describe a move in its hottest phase. That says nothing about the direction of the coming days, but it does say something about the relationship between possible gain and possible loss, which has shifted to a buyer's disadvantage.
In the long run, over quarters, the answer hangs on a question that is open today. If the token participates economically in the use of the network, a valuation of $2.71 billion for a provider with a mandate in US payments is debatable. If it does not, the market is valuing a link that does not exist contractually. That can be examined in the technical documentation, and it should be examined before a decision.
This assessment counts as refuted if one of three things happens. First: the provider discloses a documented mechanism that ties revenue from the network to the token. Second: after the first clear setback the price holds the zone around $106.64 and builds volume there over weeks. Third: the network slips beyond the first half of 2027, or Quant loses its role in it.
The price targets we derive for Quant, in three scenarios with disclosed weighting, are set out in our Quant price prediction 2026 to 2030.
Buying Quant: what to take away
- The trend break is complete but untested: $224.13 against an old twelve-month high of $106.64, and only the setback will show whether the zone holds. Suitable charting tools are offered by the trading venues in the exchange comparison.
- The open question is the token's participation in the business, not the quality of the mandate. The background is in our assessment of Quant and tokenised deposits.
- Anyone buying settles execution and custody beforehand. A thin order book makes the limit order the standard tool, and for longer holding periods self-custody follows, which the hardware wallet comparison covers.
Disclosure: some of the providers named in this article work with us through partner programmes. That has no influence on the price analysis or on the assessment of the chart situation; the price data comes from a public market data source and is verifiable there.
(As of September 27, 2026. This article is not investment advice. Prices and fee structures change; check the terms with the provider before you buy. Crypto assets are subject to sharp price swings, and a total loss is possible.)
Transparency note: This article was produced with the assistance of artificial intelligence and reviewed by our editorial team before publication. All figures and claims were checked against the primary sources linked in the text. The feature image was generated with AI.
Related articles
Which topics should we dive deeper into?
Select what genuinely interests you. Your picks feed directly into our editorial planning.
Crypto news that's actually worth your time.
Weekly. 60 seconds. Carefully curated by our editors: no hype, no promo flood, no spam.

May 13, 2026 11:02 AM

Is PEPE Coin worth Buying in 2026?
PEPE has reclaimed both its 50 day and its 200 day average, with trading volume back at its yearly norm. What that means for anyone buying at current prices, and the two levels that settle it.
September 28, 2026 9:47 AM
XRP Price Drops Below $1.50: Where Is Ripple Heading This Week?
XRP price slips under $1.50 after a red weekend. Here is the XRP price analysis with the higher and lower targets that matter this week.

August 23, 2026 1:16 AM

Is PEPE a Good Buy at the Current Price?
PEPE is back above both moving averages and the 50-day has crossed the 200-day. Is the memecoin a good buy at the current price, or is the rally already running on thin volume?
August 24, 2026 12:50 AM
Is Bitcoin Cash a Good Buy at Current Prices?
Bitcoin Cash has rallied hard off its June floor, but it still trades below its long-term trend line with the RSI stretched. We work through what speaks for and against buying BCH at current prices.
August 24, 2026 12:34 AM
Is Monero a Good Buy at Current Prices?
Monero holds above both of its long-term averages after a strong summer, yet still trades far below its twelve-month high. We look at what the trend, the turnover and the regulatory picture mean for anyone weighing a purchase of XMR now.
August 24, 2026 12:19 AM
Is Zcash a Good Buy at Current Prices?
Zcash has run far ahead of its own long-term averages after a week that changed the chart. We look at what the trend, the RSI and the turnover actually support, and under which conditions the case for buying ZEC breaks down.
August 11, 2026 5:35 PM

Is Ethereum a Good Buy at Current Prices?
Ethereum has fallen further than Bitcoin and recovered better of late. What chart structure, the fee mechanism and trading volume say about buying at current prices.
August 11, 2026 5:35 PM

Is Bitcoin a Good Buy at Current Prices?
Bitcoin trades about a third below its twelve-month high and has reclaimed both moving averages. What chart structure, RSI and trading volume say about buying at current prices.
August 3, 2026 10:41 AM
Is XRP Coin a Good Buy At Current Prices?
XRP trades at $1.4797 and is holding above the 200-day EMA. Why that line at $1.3894 now decides, as support, whether the reversal holds.
June 18, 2026 10:57 PM
Is Solana (SOL) a Good Buy at Current Prices?
Solana has traded above its 200-day average since August, the 50-day average joined it on 21 September, and volume is now keeping pace. What chart structure, issuance and tokenisation say about buying at current prices.
September 20, 2026 9:21 AM

Is Ethena a Good Buy at Current Prices?
Ethena has rebounded hard off its twelve-month low and still trades far below its high. Is ENA a good buy at current prices? We check the chart, the supply schedule and the source of the yield with our own price data.
August 27, 2026 11:25 AM

Is Pump.fun a Good Buy at Current Prices?
PUMP has cleared both its 200-day and its 50-day average, yet it still trades well below its twelve-month high. We check with our own price data what argues for and against buying Pump.fun at the current price.
August 27, 2026 6:38 AM

Is NEAR Protocol a Good Buy at Current Prices?
NEAR has worked its way back above both of its moving averages while still trading well below its twelve-month high. We check with our own price data what speaks for and against an entry at current prices.
August 27, 2026 6:23 AM

Is Bittensor a Good Buy at Current Prices?
Bittensor has pulled well clear of its twelve-month low but keeps running into its 200-day average. We check what our own calculations from 365 daily closing prices say about buying TAO at current prices.
August 27, 2026 3:39 AM

Is Cronos a Good Buy at Current Prices?
Cronos has reclaimed its 200-day line for the first time since the spring, and the RSI is back out of overbought. We weigh what speaks for and against buying CRO at the current price.
August 26, 2026 4:21 AM

Is Uniswap a Good Buy at Current Prices?
Uniswap has cleared both of its main moving averages for the first time in months, yet momentum readings are running hot. We weigh what speaks for and against buying UNI at the current price, using our own calculations.
May 18, 2026 1:07 PM
Is Solana a Good Buy in 2026? SOL Price Analysis and Potential ROI
Solana (SOL) trades at $119.48 after clearing the $100 resistance. Here's how SOL's potential returns stack up against BTC, ETH, and XRP.
February 11, 2026 7:05 AM
5 Things to Look for BEFORE Buying Bitcoin
Thinking about entering the crypto market? Discover the 5 essential factors to check before you buy Bitcoin to secure your investment and strategy.
September 19, 2026 4:20 PM

Is Ondo a Good Buy at the Current Price?
Ondo trades above both moving averages and far below its twelve-month high. We examine the chart position, trading volume and supply mechanics, and set out what argues for and against buying the ONDO token.
August 31, 2026 11:20 PM

Is Mantle a Good Buy at Current Prices?
Mantle has rebounded hard from its summer low but still trades below its 200-day line, and nearly half the eventual supply has yet to reach the market. We weigh what speaks for and against buying MNT at the current price.
August 29, 2026 4:26 PM
Is Aster a Good Buy at Current Prices?
Aster sits above both moving averages and at the same time far below its high since listing. We assess whether the token is a good buy at the current price and why the supply still to be released remains the weightiest objection.
August 23, 2026 2:21 PM

Is Hyperliquid a Good Buy at Current Prices?
HYPE set its twelve-month high in September and has given part of it back, with the RSI now neutral. We weigh chart, RSI, trading volume and supply mechanics to see what argues for and against buying Hyperliquid at current prices.

July 17, 2026 7:55 PM
Is XRP a Good Investment in 2026? Price Analysis and Prediction
XRP has broken out of its summer range and is holding above its 200-day average — without the catalyst the market waited a year for. What the chart, the CLARITY Act and 2026 forecasts really say.
March 29, 2026 2:07 PM
Is Ethereum a Good Store of Value?
Is Ethereum a reliable store of value? We analyze ETH price history, the "ultrasound money" narrative, and its long-term potential for 2026 and beyond.
February 8, 2025 10:00 PM
Top 3 Reasons Why Ethereum Price Is a Good Buy Today
Despite recent price drops and rising competition, Ethereum shows strong signs of a potential rebound. Discover the key factors making ETH a smart buy right now.



More from CryptoTicker