
Is AAVE a Good Buy at Current Prices?
AAVE has worked its way back above both the 200-day and the 50-day moving average, yet still trades far below its twelve-month high. Using our own price data, we examine what speaks for and against an entry at current prices.





Which topics should we dive deeper into?
Select what genuinely interests you. Your picks feed directly into our editorial planning.
Crypto news that's actually worth your time.
Weekly. 60 seconds. Carefully curated by our editors: no hype, no promo flood, no spam.
As of September 30, 2026: AAVE with updated figures
AAVE closed at $165.22 on September 29, 2026, 28.7 percent above the $128.38 on which the analysis of August 26, 2026 below is based. The figures in this section are daily closing prices from CoinMarketCap. The price sits well above the 50-day average of $124.79 and the 200-day average of $99.50. AAVE is still 44 percent below its twelve-month high, the close of $297.34 on October 6, 2025, and 171 percent above its twelve-month low of $60.92 on June 6, 2026.
The 14-day Relative Strength Index stands at 69, just below the 70 mark above which a market is often considered overbought. Trading volume averaged around $294 million a day over the last 30 days, slightly above the 90-day average of around $261 million.
For the assessment further down this means: the recovery above both averages that had just succeeded on August 26, 2026 has continued. Buying today, however, comes after a rise of almost 30 percent in just over five weeks and with a much larger gap to the averages.
The sections below reflect the situation as of August 26, 2026.
AAVE trades at $128.38 on August 26, 2026. That is 61.8 percent below the twelve-month high of $336.27 set on August 27, 2025, and at the same time 110.7 percent above the twelve-month low of $60.93 from June 7, 2026. Both figures describe the same coin within a single year. The question that follows is this: is AAVE a good buy at current prices?
cryptoticker.io collected the price data for this article itself on August 26, 2026. The source is market data from CoinMarketCap. Daily closing prices for the past 365 days were evaluated; the moving averages, the RSI(14) and the high and low come from standard formulas applied to exactly that daily series. All figures quoted here refer to that date.
AAVE Price Analysis: Where the Price Stands and Which Levels Matter Now
The current price of $128.38 sits above both important average lines. The 200-day moving average stands at $111.95, the 50-day average at $96.25. AAVE has therefore reclaimed two levels below which the coin spent much of the year. The distance to the 200-day average is about 15 percent, the distance to the 50-day average about 33 percent.
That names the nearest support clearly. If the price falls back, the zone around $111 to $115 is the first stop, because the 200-day average runs there. If it does not hold, the next serious floor lies only around $96, where the 50-day average is catching up. Above the current price the ground is thinner: between here and the area around $170, the market spent little time over the past year, which can accelerate moves in either direction.
For the wider picture, the market capitalisation of roughly $1.98 billion matters, placing AAVE 39th in the overall market. How that starting position translates into medium-term price ranges is set out in the continuously updated AAVE price prediction from cryptoticker.io.
Is the AAVE Downtrend Broken or Merely Interrupted?
Over twelve months AAVE stands at minus 59.7 percent. The coin began the period at $318.27 and trades today at $128.38. That is one half of the calculation. The other: over 90 days it is up 59.6 percent, over 30 days up 27.5 percent, over seven days up 46.5 percent. From the twelve-month low of $60.93 the price has more than doubled.
Technically, there is a good deal to suggest the downtrend has at least been interrupted. A price above the 200-day average of $111.95 counts in the classical reading as a change of trend, and the 50-day average at $96.25 is now rising rather than falling. Both are marks of a bottoming process that lies behind the coin.
What argues against declaring the danger over is the speed. A gain of 46.5 percent in seven days is a surge that can be given back just as quickly. In our view the change of trend is disproved once AAVE falls back below the 200-day average at $111.95 on a daily closing basis and stays there for several days. Until then, the return to the twelve-month high of $336.27 remains a distance of roughly 162 percent.
What RSI and Moving Averages Mean for an AAVE Entry
The RSI(14) stands at 74.5. Readings above 70 count as overbought. That is neither a recommendation to sell nor a signal of an imminent setback, because in strong upward phases the RSI can stay above this mark for weeks. It is an indication that a large part of the short-term move has already happened.
The arrangement of the averages reads more favourably. The price of $128.38 sits above the 200-day average of $111.95, which in turn sits above the 50-day average of $96.25. This ordering typically emerges after extended bottoming phases and counts as constructive.
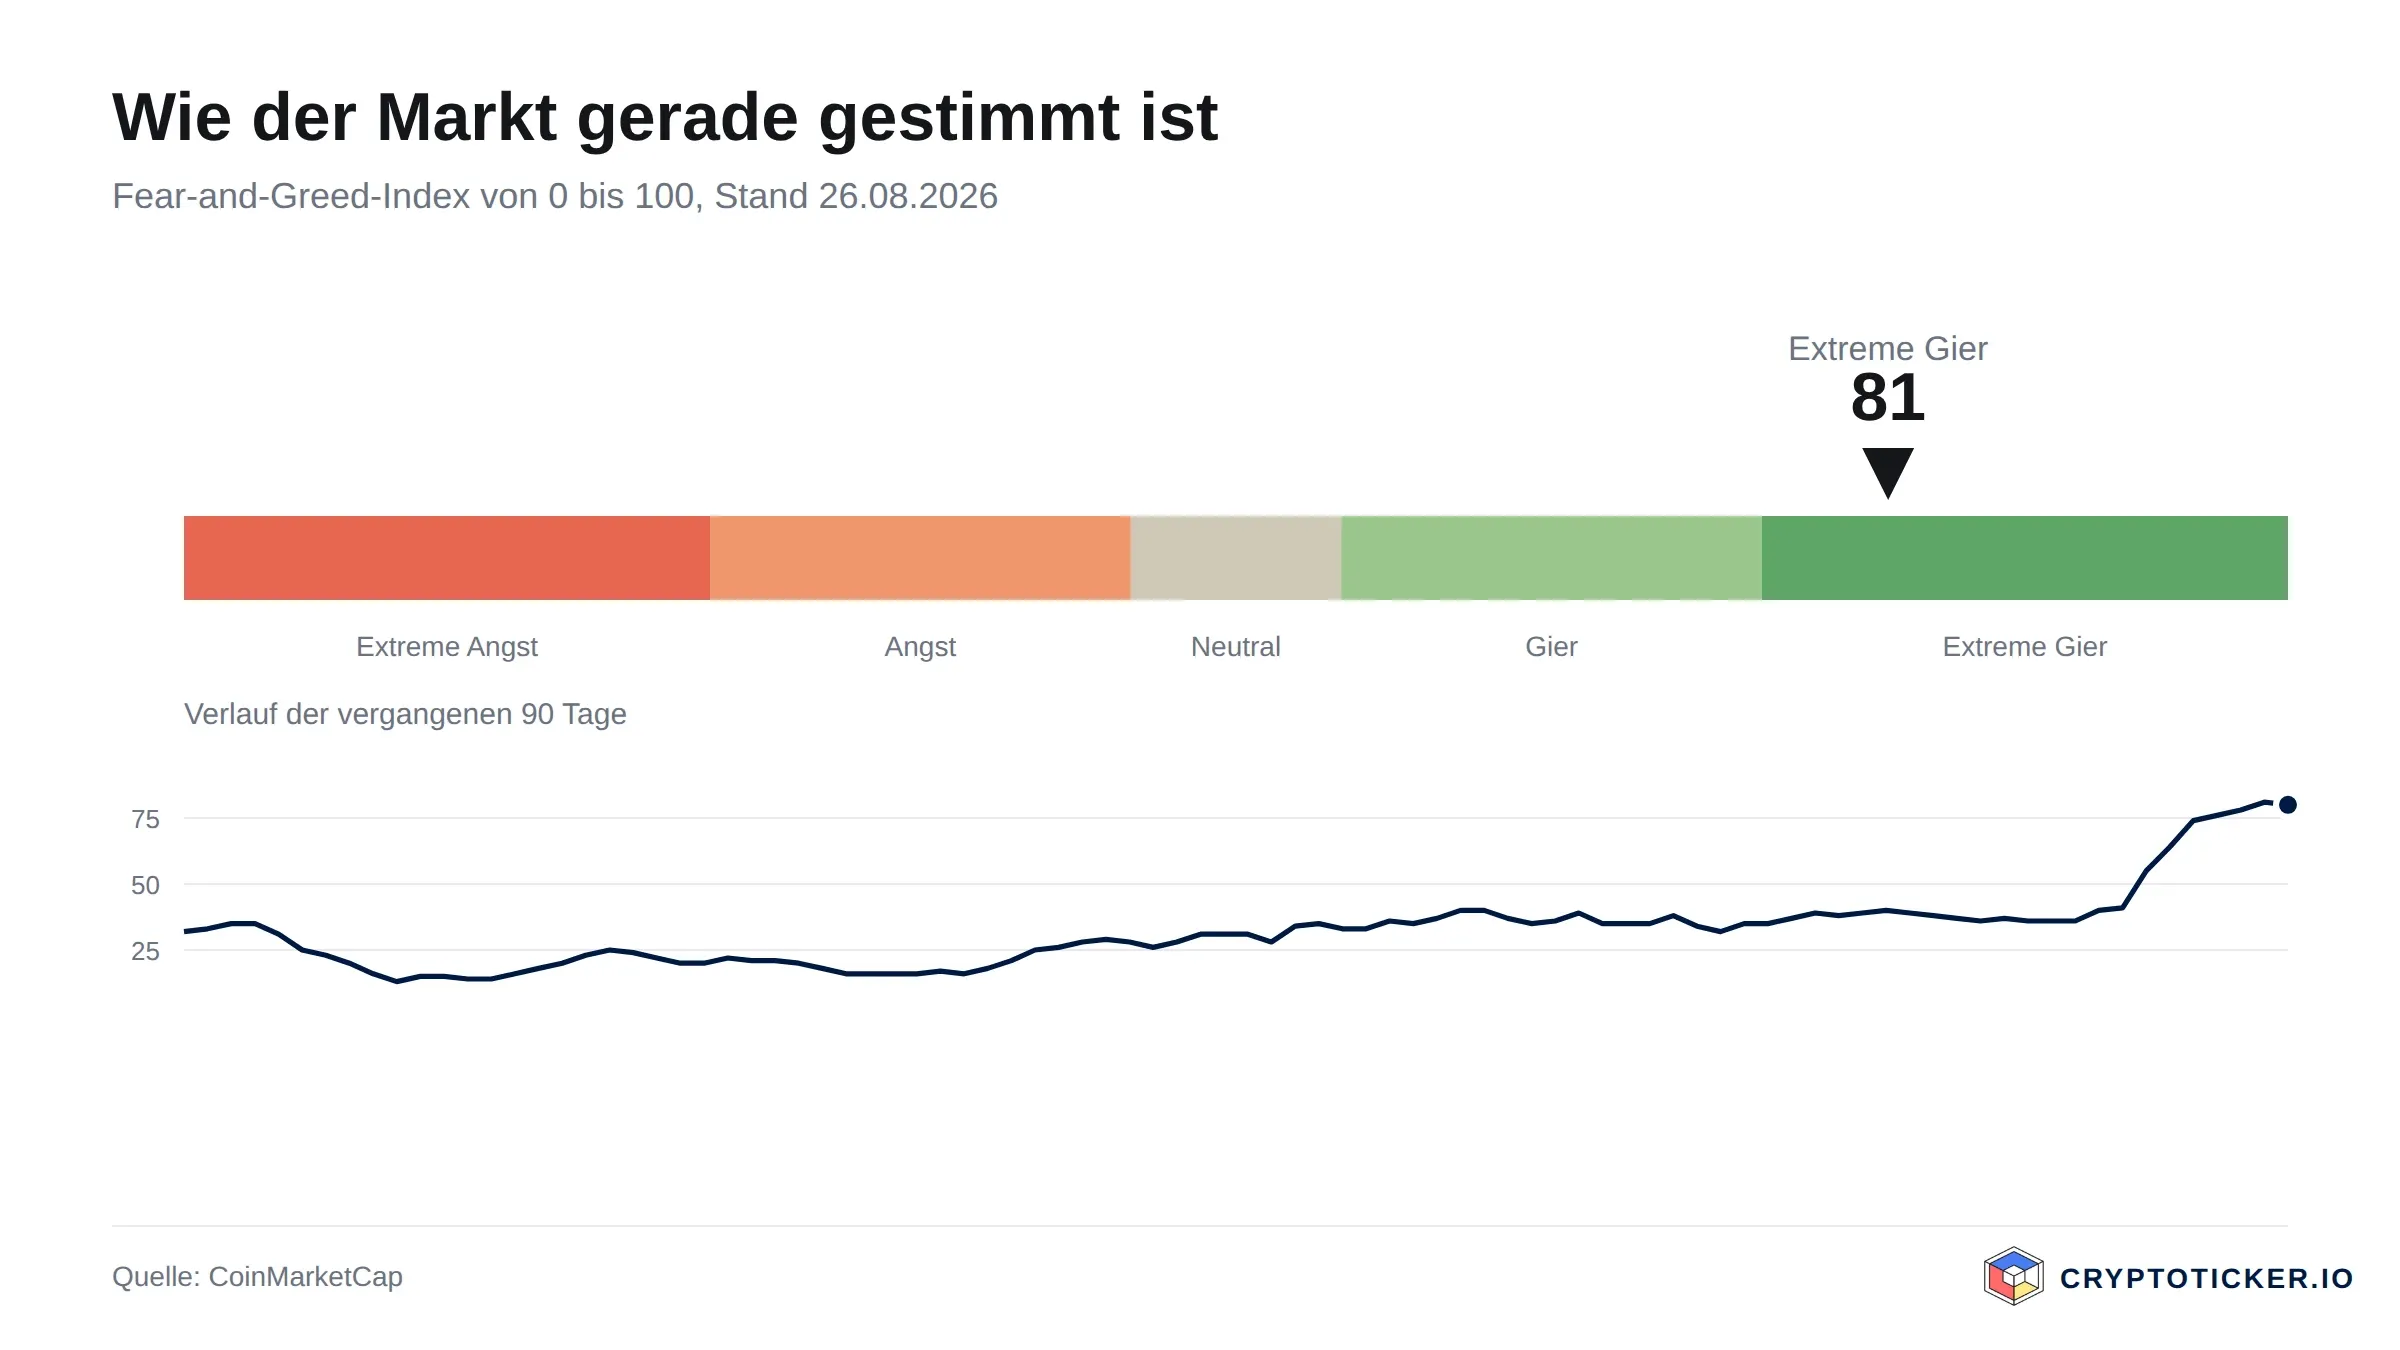
In practice, the combination of an overbought RSI and an intact structure of averages means that purchases at the current price carry a worse ratio of opportunity to risk than purchases during a pullback. Market sentiment supports caution: the CoinMarketCap Fear and Greed Index stands at 81 points, within the range of extreme greed.
What AAVE Trading Volume Reveals About Demand
Trading volume over the past 24 hours came to roughly $299 million. For comparison: the average over the past 30 days is about $263 million, the average over the past 90 days about $238 million. Current volume sits above both reference points, though not dramatically so.
More revealing is the peak reached during the advance. At the high point of the past trading week, some $641 million changed hands in a single day, more than twice the 30-day average. A rise carried by a jump in turnover of that size has more substance than a move on thin trading.
Volume has since fallen back to less than half that peak. That is normal after a surge, but it means demand is no longer at the level that produced the advance. For the buying decision this reads as follows: the move was real, its continuation is not thereby established.
Which Structural Factors Speak for AAVE
AAVE is the governance token of the lending protocol of the same name, through which users deposit crypto assets and borrow against collateral. The token serves to vote on protocol parameters and is used in the protocol's safety module. Its value therefore depends in part on how far the protocol is used, and not on general market sentiment alone.
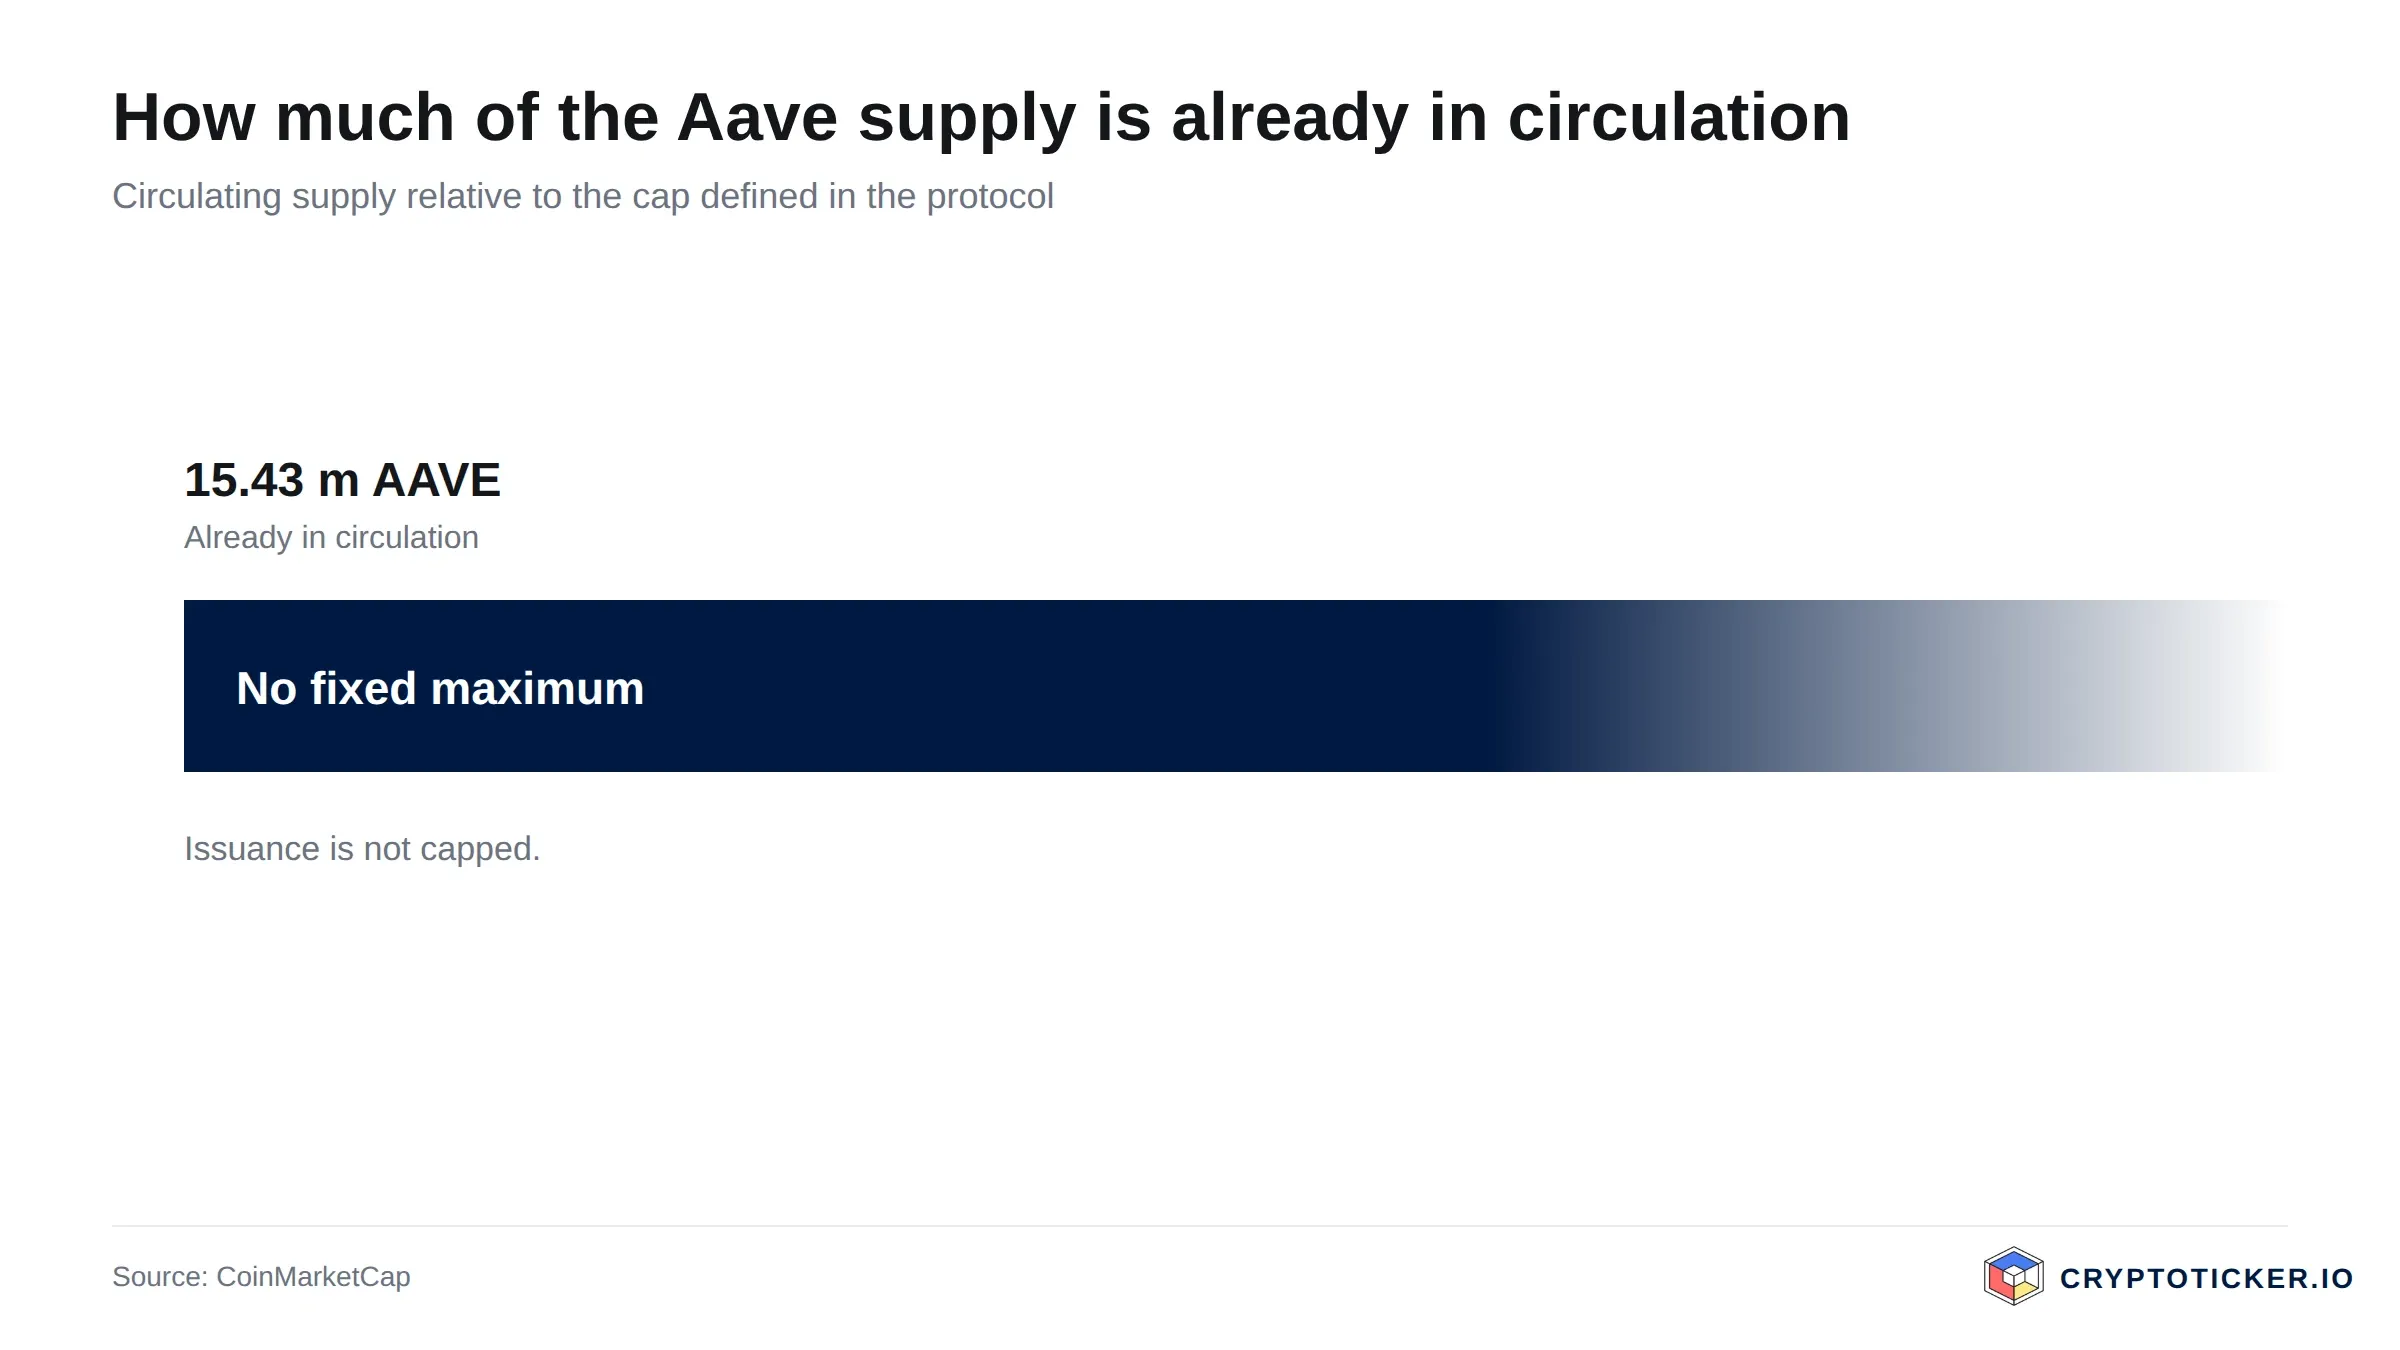
The supply mechanics are tightly bounded. Around 15.42 million AAVE are in circulation, with total supply at 16 million according to CoinMarketCap. More than 96 percent of supply is therefore already on the market. Unlike projects with long unlock schedules, there is no large stream of team or investor allocations waiting to dilute existing positions.
The third factor is the technical base. The protocol is anchored on Ethereum and additionally runs on several second-layer networks. How that base develops is described by the official Ethereum roadmap. In regulatory terms the field operates in Europe under the MiCA regulation; supervisory practice is documented by the European Securities and Markets Authority, ESMA. For decentralised lending protocols the European legal position remains open in parts, which we flag as an assumption and not as a settled forecast.
What Speaks for Buying AAVE at Current Prices
First, the distance to the upside. At $128.38 the price sits 61.8 percent below the twelve-month high of $336.27. Should the market return to a phase in which lending protocols are in demand again, the arithmetic road upward is long. That is not a price target but a description of the room available.
Second, the technical starting position. The price stands above the 200-day average of $111.95 and above the 50-day average of $96.25. The coin did not have this arrangement for almost the whole of the past year. It also supplies a clearly defined level at which a failure can be recognised.
Third, the supply side. With around 15.42 million tokens in circulation against a total supply of 16 million, supply is almost fully distributed. Price advances here do not have to run against ongoing unlocks.
What Speaks Against Buying AAVE at Current Prices
First, the timing. An RSI(14) of 74.5 after a weekly gain of 46.5 percent describes a market that has already run. The Fear and Greed Index at 81 points points the same way.
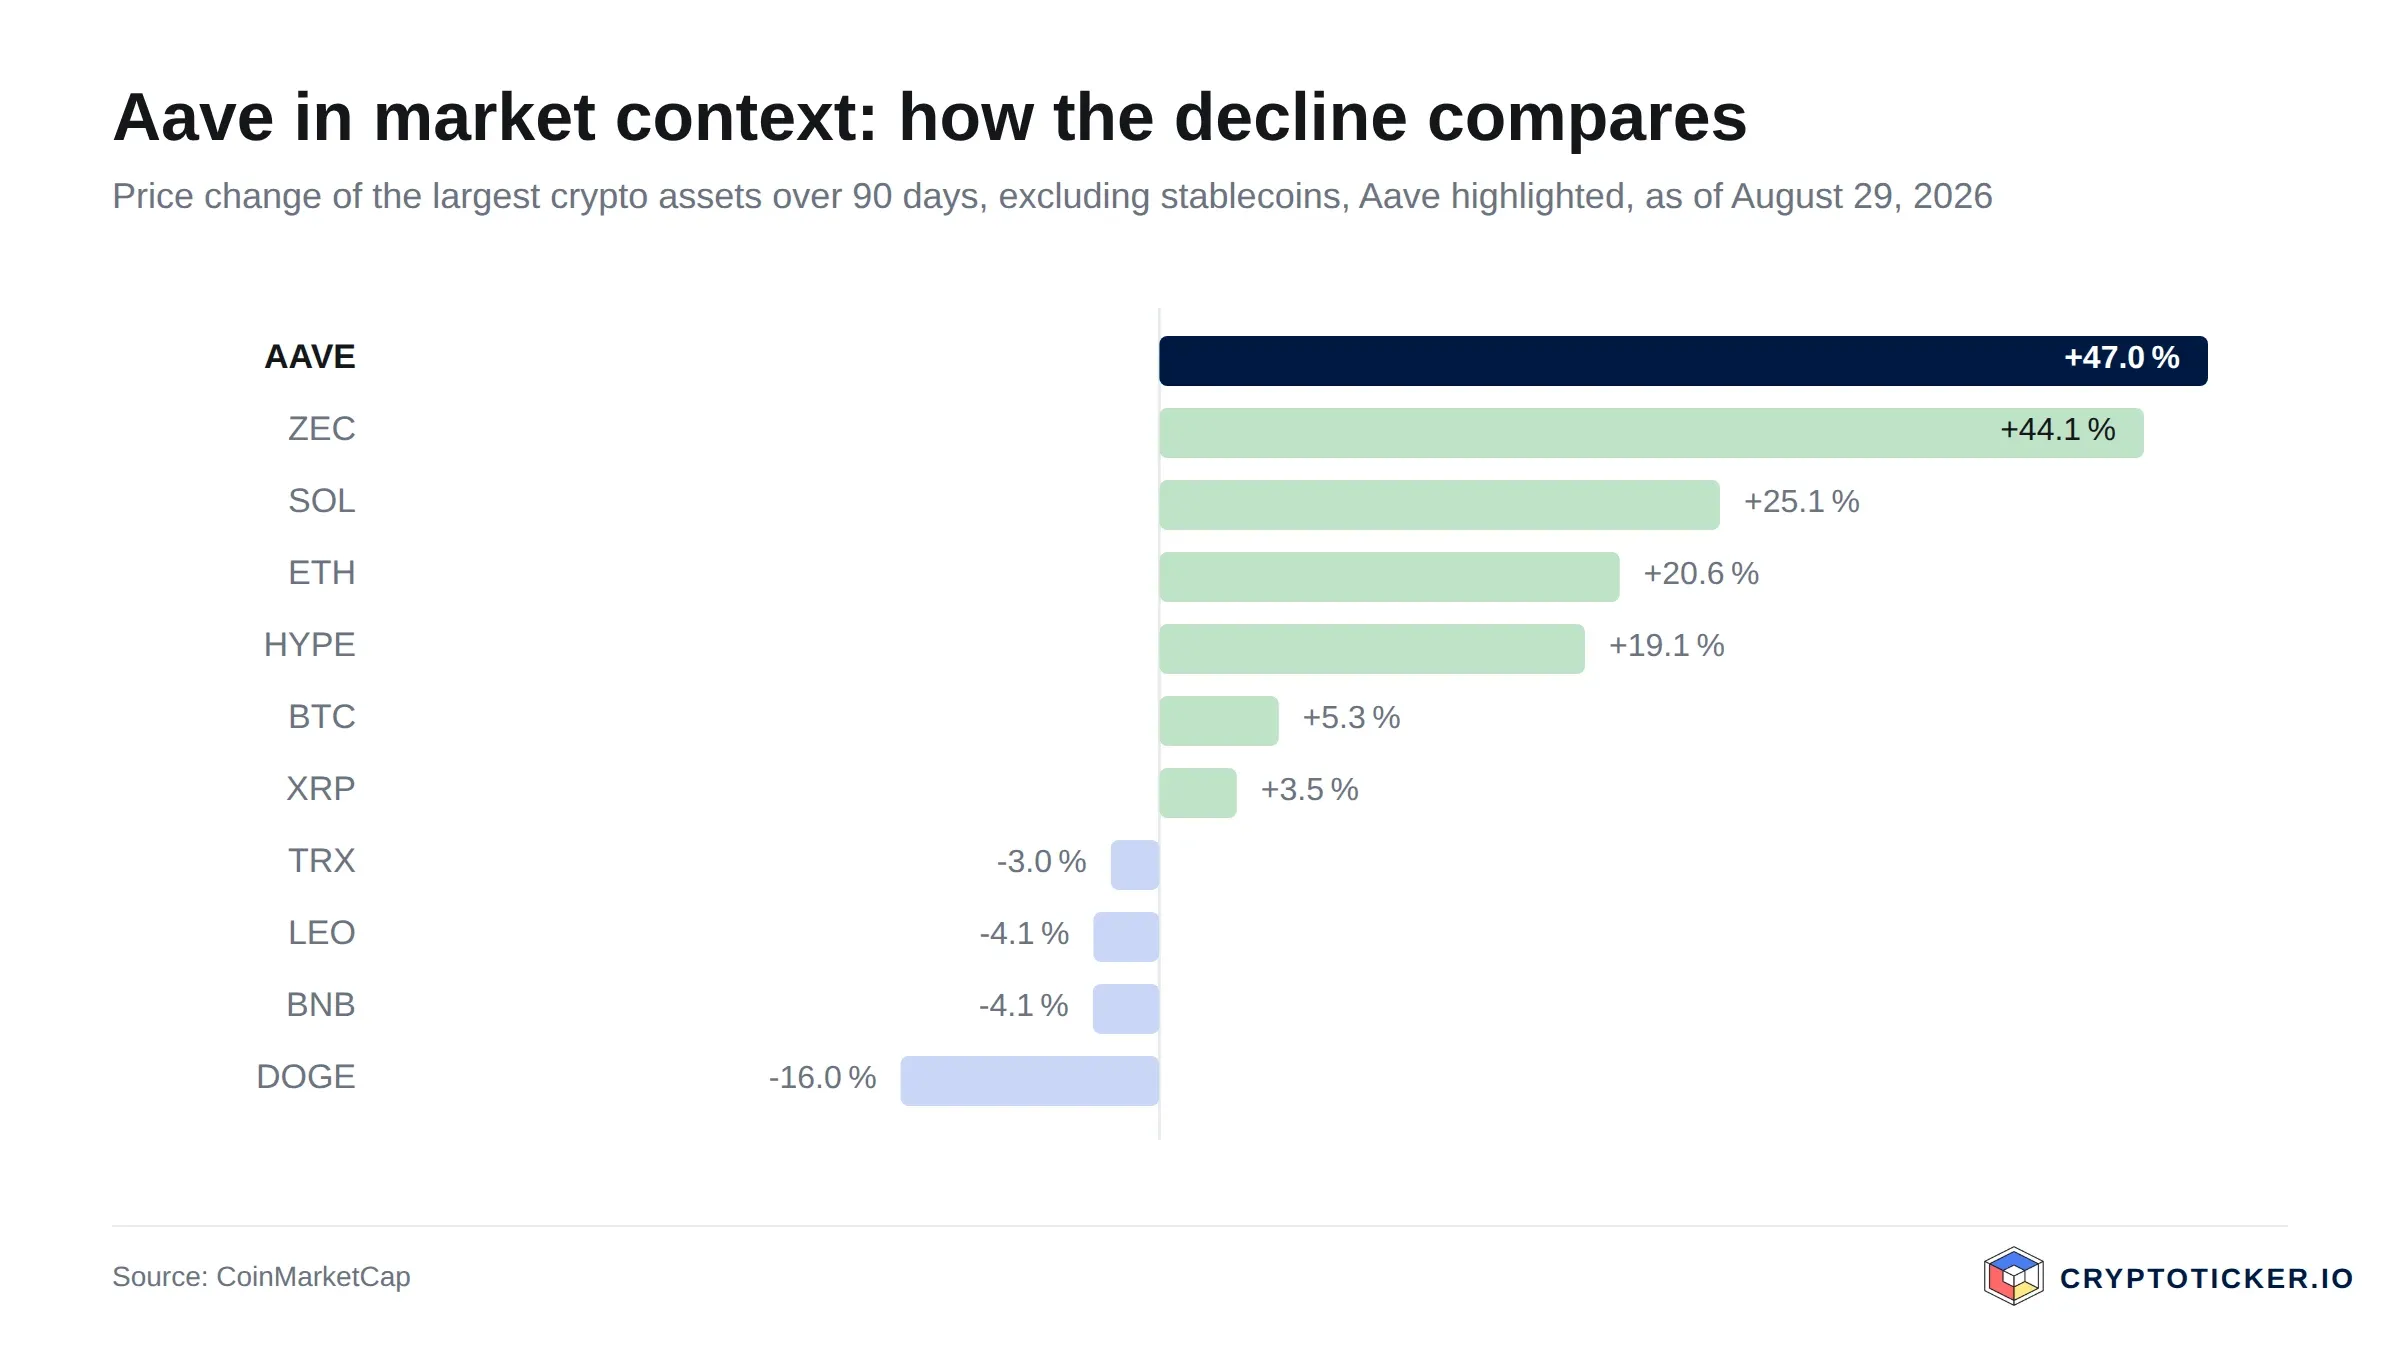
Second, the annual balance. Minus 59.7 percent over twelve months is the result of a long downtrend from $318.27 to $60.93 at its lowest. A price above the averages is a beginning and not yet evidence that this trend has ended.
Third, the business risk of the protocol. Lending protocols carry risks that a pure payment coin does not: liquidation cascades in fast downward phases, dependence on price oracles, and the possibility of errors in the program code. These risks are known and documented, but they cannot be ruled out.
How to Buy AAVE at Current Prices
AAVE is listed on the major European trading venues. Which exchange suits you depends above all on three points: on fees, on regulation, and on whether you want to hold your balances yourself. An overview of costs and terms is given by our comparison of the best crypto exchanges; if European supervision matters to you, the overview of regulated crypto exchanges takes you further. Detailed assessments of individual providers are available for Bitpanda and for Kraken.
On costs it pays to look at the spread and not only at the stated order fee. Particularly with coins outside the top ten ranks, the gap between buying and selling price often matters more than the fee itself. Check both with the provider before you buy, because terms change.
On custody: smaller amounts can stay on the exchange, larger holdings belong in a wallet only you can access. Which devices are suitable is shown by our hardware wallet comparison. Anyone who wants to put AAVE to work in the protocol itself should check the conditions of the safety module beforehand: in an emergency, part of the stake there can be drawn on to cover losses.
So Is AAVE a Good Buy at Current Prices?
In the short term the starting position is unfavourable. After 46.5 percent in seven days and with an RSI of 74.5, you are buying into an overheated move. A decline into the zone around the 200-day average at $111.95 would be normal from a technical standpoint and no break of trend. Anyone thinking in terms of weeks gets the better ratio of opportunity to risk on a pullback.
In the long term the answer depends on whether you credit the lending protocol with a lasting role. The supply side, with 15.42 million of 16 million tokens in circulation, is settled, the distance to the twelve-month high of $336.27 is large, and the price stands above both average lines again. Anyone who reads that positively finds at $128.38 an entry with a defined exit point.
The constructive reading is disproved if AAVE falls back below the 200-day average of $111.95 on a daily closing basis and settles there, or if trading volume sinks lastingly below the 90-day average of roughly $238 million. Either would be a sign that the rise from the twelve-month low of $60.93 was a recovery within a downtrend and not a turn. This is an assessment of the data, and not a recommendation to buy or sell AAVE.
Buying AAVE: What to Take Away
- The level on which everything turns is the 200-day average at $111.95. Above it the recovery stays intact, below it the downtrend returns. The medium-term price ranges are set out in the AAVE price prediction.
- The timing of an entry weighs more heavily here than the question of the coin. With an RSI of 74.5 and a weekly gain of 46.5 percent, staggered buying is the calmer option. Which venue carries the lowest costs is shown by the comparison of the best crypto exchanges.
- Anyone planning to hold for longer settles custody before buying. Suitable devices and how they differ are set out in the hardware wallet comparison.
Disclosure: some of the providers named in this article work with us through partner programmes. This has no influence on the price analysis or on the assessment of the chart position; the price data come from a public market data source and can be verified there.
(As of August 26, 2026. This article is not investment advice. Prices and fee structures change; check the terms with the provider before you buy. Crypto assets are subject to sharp price swings and a total loss is possible.)
Frequently asked questions about AAVE
Transparency note: This article was produced with the assistance of artificial intelligence and reviewed by our editorial team before publication. All figures and claims were checked against the primary sources linked in the text. The feature image was generated with AI.
Related articles
Which topics should we dive deeper into?
Select what genuinely interests you. Your picks feed directly into our editorial planning.
Crypto news that's actually worth your time.
Weekly. 60 seconds. Carefully curated by our editors: no hype, no promo flood, no spam.

August 16, 2026 12:21 PM

Is Toncoin a Good Buy at Current Prices?
Toncoin has reclaimed both of its moving averages and now goes by the name Gram. We weigh what the chart, the RSI and the recovery in trading volume say for and against buying at current prices.

May 13, 2026 11:02 AM

Is PEPE Coin worth Buying in 2026?
PEPE has reclaimed both its 50 day and its 200 day average, with trading volume back at its yearly norm. What that means for anyone buying at current prices, and the two levels that settle it.
September 28, 2026 9:47 AM
XRP Price Drops Below $1.50: Where Is Ripple Heading This Week?
XRP price slips under $1.50 after a red weekend. Here is the XRP price analysis with the higher and lower targets that matter this week.
August 23, 2026 1:16 AM

Is PEPE a Good Buy at the Current Price?
PEPE is back above both moving averages and the 50-day has crossed the 200-day. Is the memecoin a good buy at the current price, or is the rally already running on thin volume?
August 24, 2026 12:50 AM
Is Bitcoin Cash a Good Buy at Current Prices?
Bitcoin Cash has rallied hard off its June floor, but it still trades below its long-term trend line with the RSI stretched. We work through what speaks for and against buying BCH at current prices.
August 24, 2026 12:34 AM
Is Monero a Good Buy at Current Prices?
Monero holds above both of its long-term averages after a strong summer, yet still trades far below its twelve-month high. We look at what the trend, the turnover and the regulatory picture mean for anyone weighing a purchase of XMR now.
August 24, 2026 12:19 AM
Is Zcash a Good Buy at Current Prices?
Zcash has run far ahead of its own long-term averages after a week that changed the chart. We look at what the trend, the RSI and the turnover actually support, and under which conditions the case for buying ZEC breaks down.
August 11, 2026 5:35 PM

Is Ethereum a Good Buy at Current Prices?
Ethereum has fallen further than Bitcoin and recovered better of late. What chart structure, the fee mechanism and trading volume say about buying at current prices.
August 11, 2026 5:35 PM

Is Bitcoin a Good Buy at Current Prices?
Bitcoin trades about a third below its twelve-month high and has reclaimed both moving averages. What chart structure, RSI and trading volume say about buying at current prices.
June 18, 2026 10:57 PM
Is Solana (SOL) a Good Buy at Current Prices?
Solana has traded above its 200-day average since August, the 50-day average joined it on 21 September, and volume is now keeping pace. What chart structure, issuance and tokenisation say about buying at current prices.

July 17, 2026 7:55 PM
Is XRP a Good Investment in 2026? Price Analysis and Prediction
XRP has broken out of its summer range and is holding above its 200-day average — without the catalyst the market waited a year for. What the chart, the CLARITY Act and 2026 forecasts really say.
September 20, 2026 9:21 AM

Is Ethena a Good Buy at Current Prices?
Ethena has rebounded hard off its twelve-month low and still trades far below its high. Is ENA a good buy at current prices? We check the chart, the supply schedule and the source of the yield with our own price data.
August 27, 2026 11:25 AM

Is Pump.fun a Good Buy at Current Prices?
PUMP has cleared both its 200-day and its 50-day average, yet it still trades well below its twelve-month high. We check with our own price data what argues for and against buying Pump.fun at the current price.
August 27, 2026 6:38 AM

Is NEAR Protocol a Good Buy at Current Prices?
NEAR has worked its way back above both of its moving averages while still trading well below its twelve-month high. We check with our own price data what speaks for and against an entry at current prices.
August 27, 2026 6:23 AM

Is Bittensor a Good Buy at Current Prices?
Bittensor has pulled well clear of its twelve-month low but keeps running into its 200-day average. We check what our own calculations from 365 daily closing prices say about buying TAO at current prices.
August 27, 2026 3:39 AM

Is Cronos a Good Buy at Current Prices?
Cronos has reclaimed its 200-day line for the first time since the spring, and the RSI is back out of overbought. We weigh what speaks for and against buying CRO at the current price.
August 26, 2026 4:21 AM

Is Uniswap a Good Buy at Current Prices?
Uniswap has cleared both of its main moving averages for the first time in months, yet momentum readings are running hot. We weigh what speaks for and against buying UNI at the current price, using our own calculations.
May 18, 2026 1:07 PM

Is Solana a Good Buy in 2026? SOL Price Analysis and Potential ROI
Solana (SOL) trades at $119.48 after clearing the $100 resistance. Here's how SOL's potential returns stack up against BTC, ETH, and XRP.
May 2, 2026 8:43 AM
Top 5 Cryptocurrencies to Buy in May 2026: Altcoin Season Next?
May 2026 starts with Bitcoin leading the charge above $78k. While some altcoins lag, others present unique accumulation opportunities for investors.
February 11, 2026 7:05 AM
5 Things to Look for BEFORE Buying Bitcoin
Thinking about entering the crypto market? Discover the 5 essential factors to check before you buy Bitcoin to secure your investment and strategy.
December 19, 2024 2:31 PM

XRP Crash: What Happened and What's Next for the Last Days of 2024?
XRP recent crash has left investors on edge as the crypto faces significant market turbulence. But what are the reasons behind the drop?
September 19, 2026 4:20 PM

Is Ondo a Good Buy at the Current Price?
Ondo trades above both moving averages and far below its twelve-month high. We examine the chart position, trading volume and supply mechanics, and set out what argues for and against buying the ONDO token.
August 31, 2026 11:20 PM

Is Mantle a Good Buy at Current Prices?
Mantle has rebounded hard from its summer low but still trades below its 200-day line, and nearly half the eventual supply has yet to reach the market. We weigh what speaks for and against buying MNT at the current price.
August 29, 2026 4:26 PM
Is Aster a Good Buy at Current Prices?
Aster sits above both moving averages and at the same time far below its high since listing. We assess whether the token is a good buy at the current price and why the supply still to be released remains the weightiest objection.
August 23, 2026 2:21 PM

Is Hyperliquid a Good Buy at Current Prices?
HYPE set its twelve-month high in September and has given part of it back, with the RSI now neutral. We weigh chart, RSI, trading volume and supply mechanics to see what argues for and against buying Hyperliquid at current prices.

More from CryptoTicker