
Is Aerodrome Finance a Good Buy at Current Prices?
Aerodrome Finance has lost about a third since mid-October and is now testing its 200-day average. Whether AERO is a good buy at current prices comes down to a few key levels.


Which topics should we dive deeper into?
Select what genuinely interests you. Your picks feed directly into our editorial planning.
Crypto news that's actually worth your time.
Weekly. 60 seconds. Carefully curated by our editors: no hype, no promo flood, no spam.
Aerodrome Finance trades at around $0.63 on 4 November 2026. That puts AERO 47.3 per cent below its 12-month high of $1.19, set on 11 November 2025, and 124 per cent above its 12-month low of $0.28, reached on 12 February 2026. Over 30 days the token has lost 26 per cent; over 90 days it is still up 51 per cent. Is Aerodrome Finance a good buy at current prices, or would you be stepping into a correction that has further to run?
cryptoticker.io compiled the price data itself on 4 November 2026 from the daily closing prices published by CoinMarketCap, and calculated the moving averages and the RSI from that series. For a longer-term view with scenarios into next year, see our Aerodrome Finance price prediction.
Aerodrome Finance price analysis: where AERO stands now
At $0.63, the price sits just above the 200-day moving average, which we calculate as an exponential average of $0.586. The gap is a little under 7 per cent. The 50-day moving average, at $0.717, is about 14.5 per cent above the current price. AERO is therefore wedged between the two lines that analysts most often use as trend filters.
Three levels follow from this. The first support is the zone around the 200-day average at $0.59. Below that lies the September low: on 3 September 2026 AERO closed at $0.46, and from there the price climbed to $0.94 by 12 October, a gain of more than 100 per cent in under six weeks. On the upside, the 50-day average near $0.72 is the first resistance, followed by the October high.
With a market capitalisation of $1.06bn, Aerodrome Finance ranks 60th among crypto assets. That is large enough for reasonable liquidity on the main trading venues, yet small enough for individual market phases to move the price far more sharply than they move Bitcoin or Ethereum.
Has the Aerodrome Finance downtrend been broken or only interrupted?
The broad downtrend began at the 12-month high of $1.19 in November 2025. By the February 2026 low, AERO had lost 76.5 per cent. The price then turned higher and reached $0.94 in October, more than three times the February low. Since that October high Aerodrome has given back about 34 per cent, and over twelve months it is down 30 per cent.
Formally, the broad downtrend is therefore intact: the price is still almost half below the high, and the October peak stayed well short of $1. Within that frame, however, a pattern of rising lows has formed. The February low was $0.28, the early-August low $0.40 and the September low $0.46. As long as AERO holds above $0.46, the decline since October is a correction within a recovery. A daily close below that level would break the pattern, and the downtrend would turn out to have been merely interrupted.
What the RSI and moving averages mean for an Aerodrome entry
The 14-day Relative Strength Index stands at 34.5. A reading of 30 is generally treated as the threshold of oversold territory. AERO has cooled considerably, but it is not yet in the zone where rebounds become statistically more frequent. An RSI at this level suggests selling pressure is easing rather than signalling a buy.
The moving averages paint a mixed picture. The 50-day average of $0.717 is still above the 200-day average of $0.586, so the medium-term trend continues to point upwards. In the short term, though, AERO trades below its 50-day average, which means the correction since October is not over. Two signals matter for an entry: a daily close above $0.72 would end the correction, while several daily closes below $0.586 would open the way towards the September low.
 Compare exchanges to buy AERO
Aerodrome Finance trading volume: what it reveals about demand
Over the past 24 hours AERO changed hands for $52.7mn. Relative to market capitalisation, that is a turnover of about 5 per cent in a single day. Over the past 30 days, daily volume averaged $61.0mn; in the 90 days before that it averaged $52.9mn.
The figures can be read as follows. More was traded during the correction since mid-October than in late summer. Part of that is profit-taking after the strong rally, part is buyers using lower prices. The fact that current daily volume is below the 30-day average suggests that selling pressure is fading. A genuine bottom usually shows only when the price rises again on increasing volume, and that has not happened yet.
Sentiment in the wider market offers little support. CoinMarketCap's Fear and Greed Index stands at 36, in the "fear" range. In such phases smaller assets like AERO tend to fall harder than Bitcoin, although they often recover faster once sentiment turns.
Which structural factors favour Aerodrome Finance
Its role on Base. Aerodrome is a decentralised exchange on Base, the Ethereum layer-2 blockchain operated by Coinbase, and one of the largest trading venues there. Anyone swapping tokens or providing liquidity on Base often ends up at Aerodrome, either directly or via aggregators. The value of the token is therefore closely tied to activity on Base.
The token mechanics. AERO follows the so-called ve(3,3) model. Holders who lock AERO for up to four years receive veAERO and with it voting rights. Each week they use those votes to decide which liquidity pools receive newly issued AERO as rewards. In return, the trading fees and additional incentives from those pools flow to the voters, while liquidity providers are paid in AERO. The project explains the details on its website.
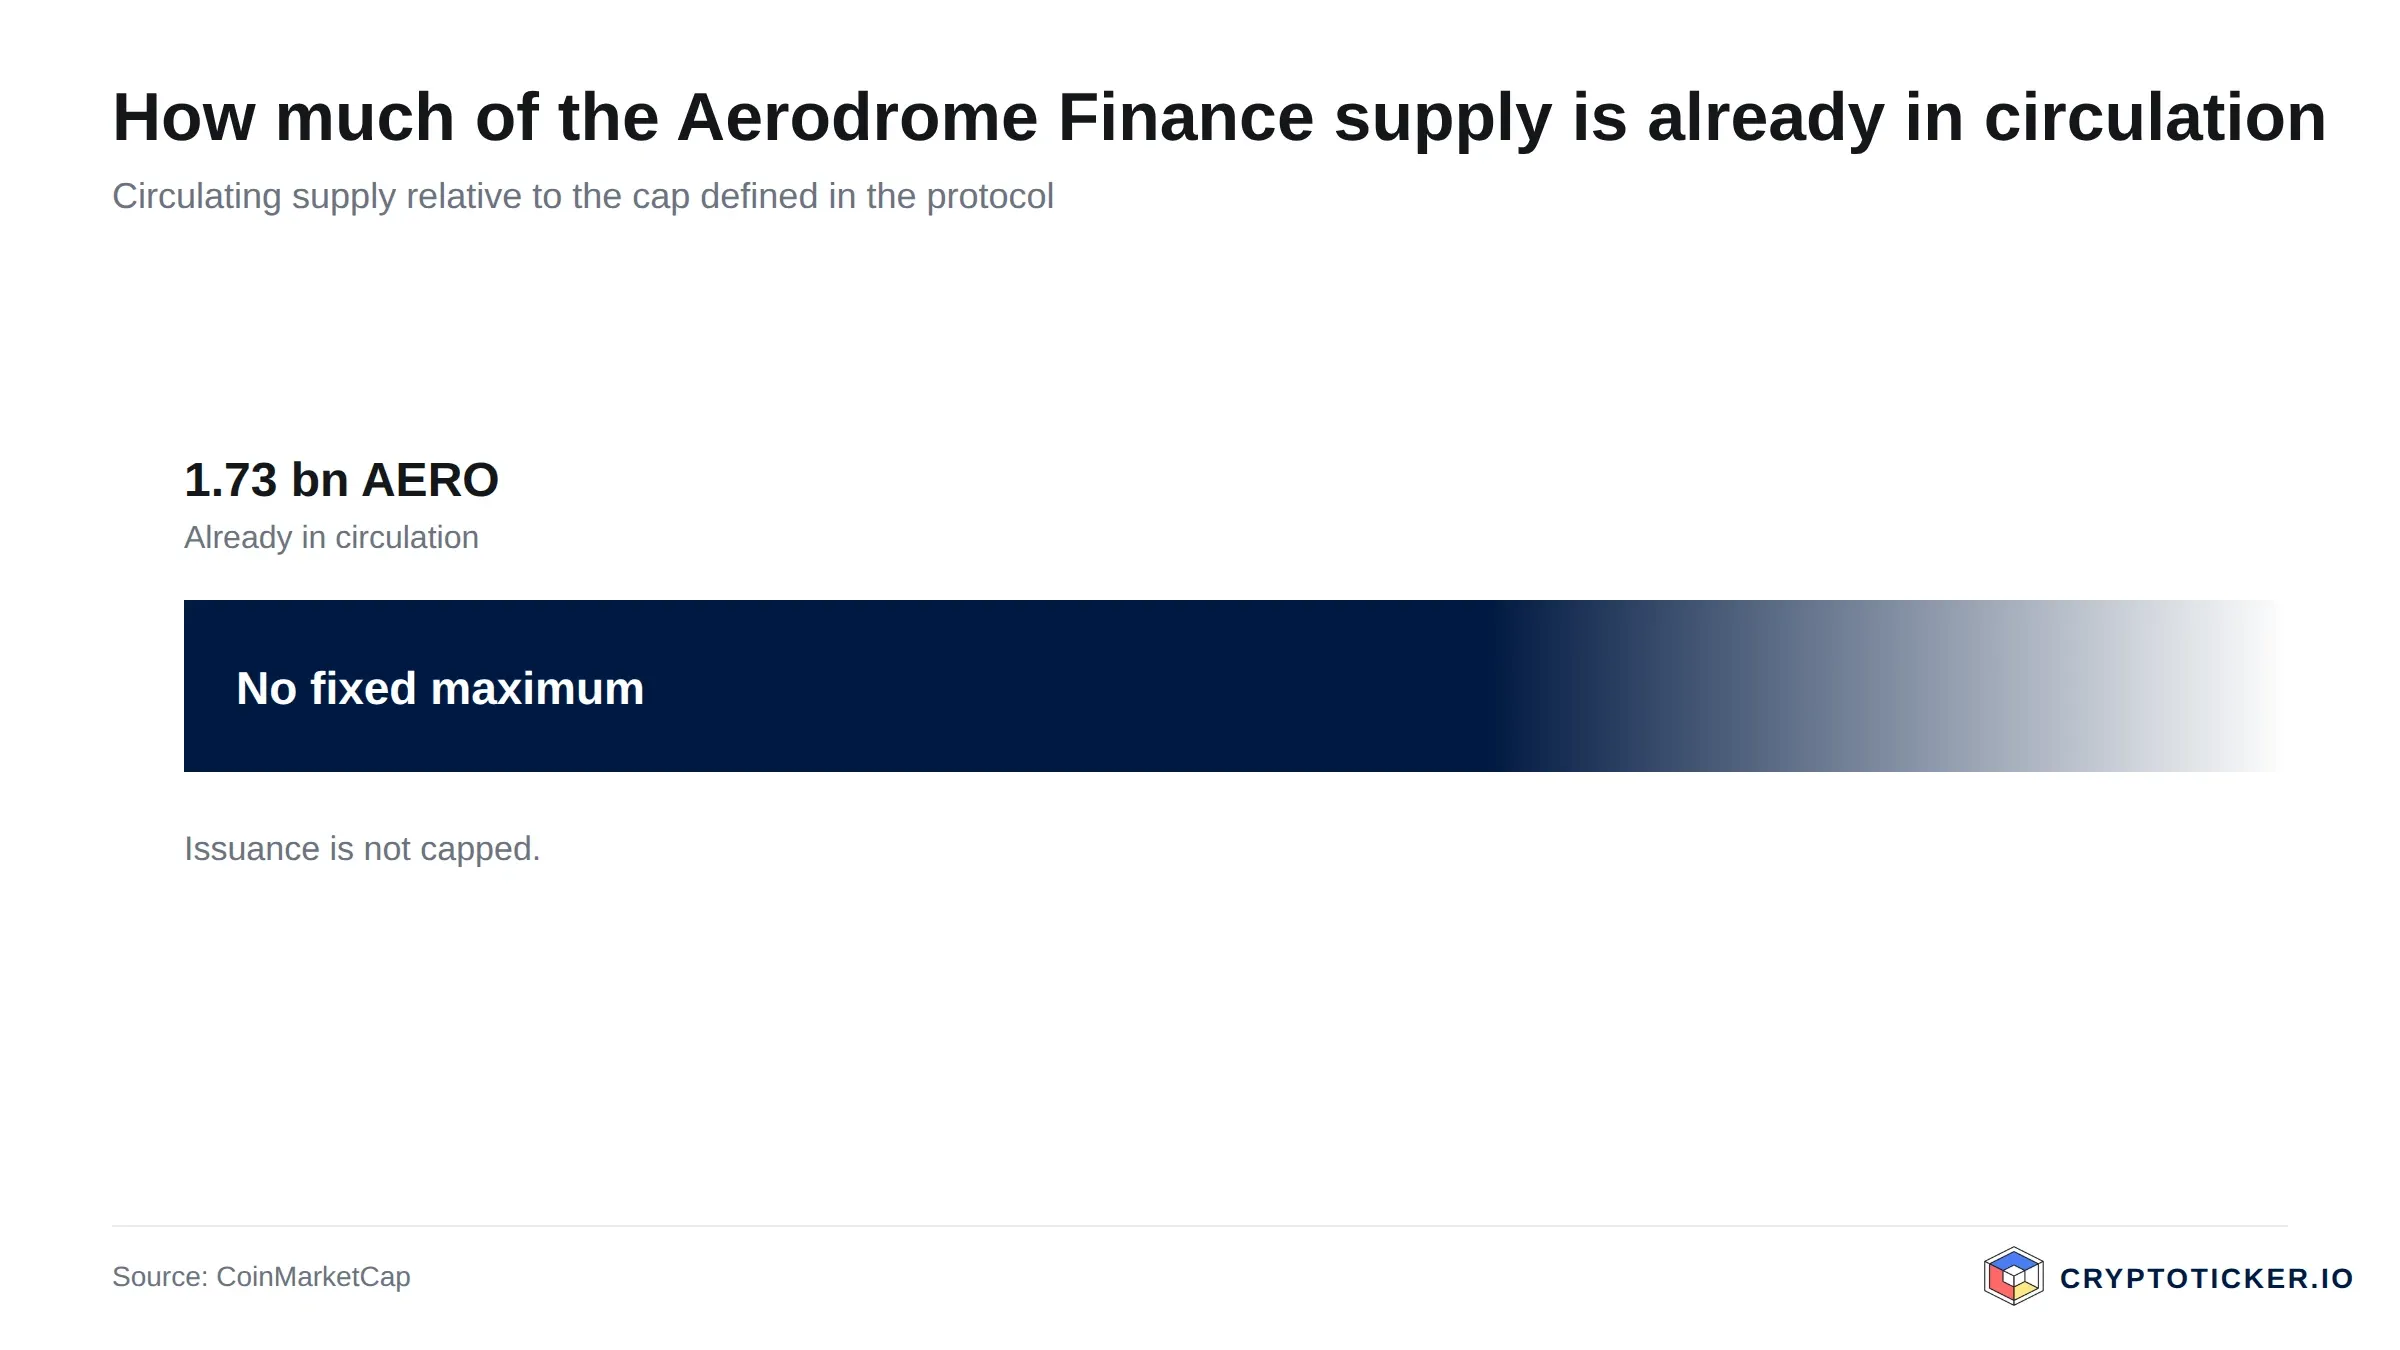
The supply. According to CoinMarketCap, about 1.70bn AERO are in circulation, with a total supply of 2.13bn tokens. There is no fixed cap; new tokens are issued continuously as rewards. How much dilution that causes depends on how much AERO is locked as veAERO at the same time.
Regulation. The EU's Markets in Crypto-Assets Regulation, MiCA, has applied in full since the end of 2024. It targets providers of crypto services such as exchanges and custodians, not a decentralised protocol itself. For buyers in Europe this means that if you buy AERO on a licensed platform, that platform's obligations apply. The European Securities and Markets Authority, ESMA, lists licensed providers in its register.
Three reasons to buy Aerodrome Finance at current prices
First, the position at the 200-day average. At $0.63, AERO trades less than 7 per cent above its 200-day average of $0.586. Buying near this level lets you define your risk tightly, because a break would become visible quickly. The RSI of 34.5 also shows that much of the selling pressure has already been absorbed.
Second, the rising lows. From the February low of $0.28 to the September low of $0.46, the floor has risen by about two-thirds. Over 90 days AERO is still up 51 per cent, and the correction since October has not yet damaged that structure.
Third, the fee-driven model. At Aerodrome, trading fees go to veAERO holders. If trading on Base grows, so do the returns on locked tokens. That gives AERO an economic link to actual usage that many other tokens lack.
Find a crypto exchange with an EU licenceThree reasons against buying Aerodrome Finance at current prices
First, the short-term downtrend. AERO has lost about 34 per cent since its October high of $0.94, almost 10 per cent of that in the past seven days. The price is below the 50-day average of $0.717. If the zone around $0.586 gives way, the next clear support is the September low of $0.46, roughly 26 per cent lower.
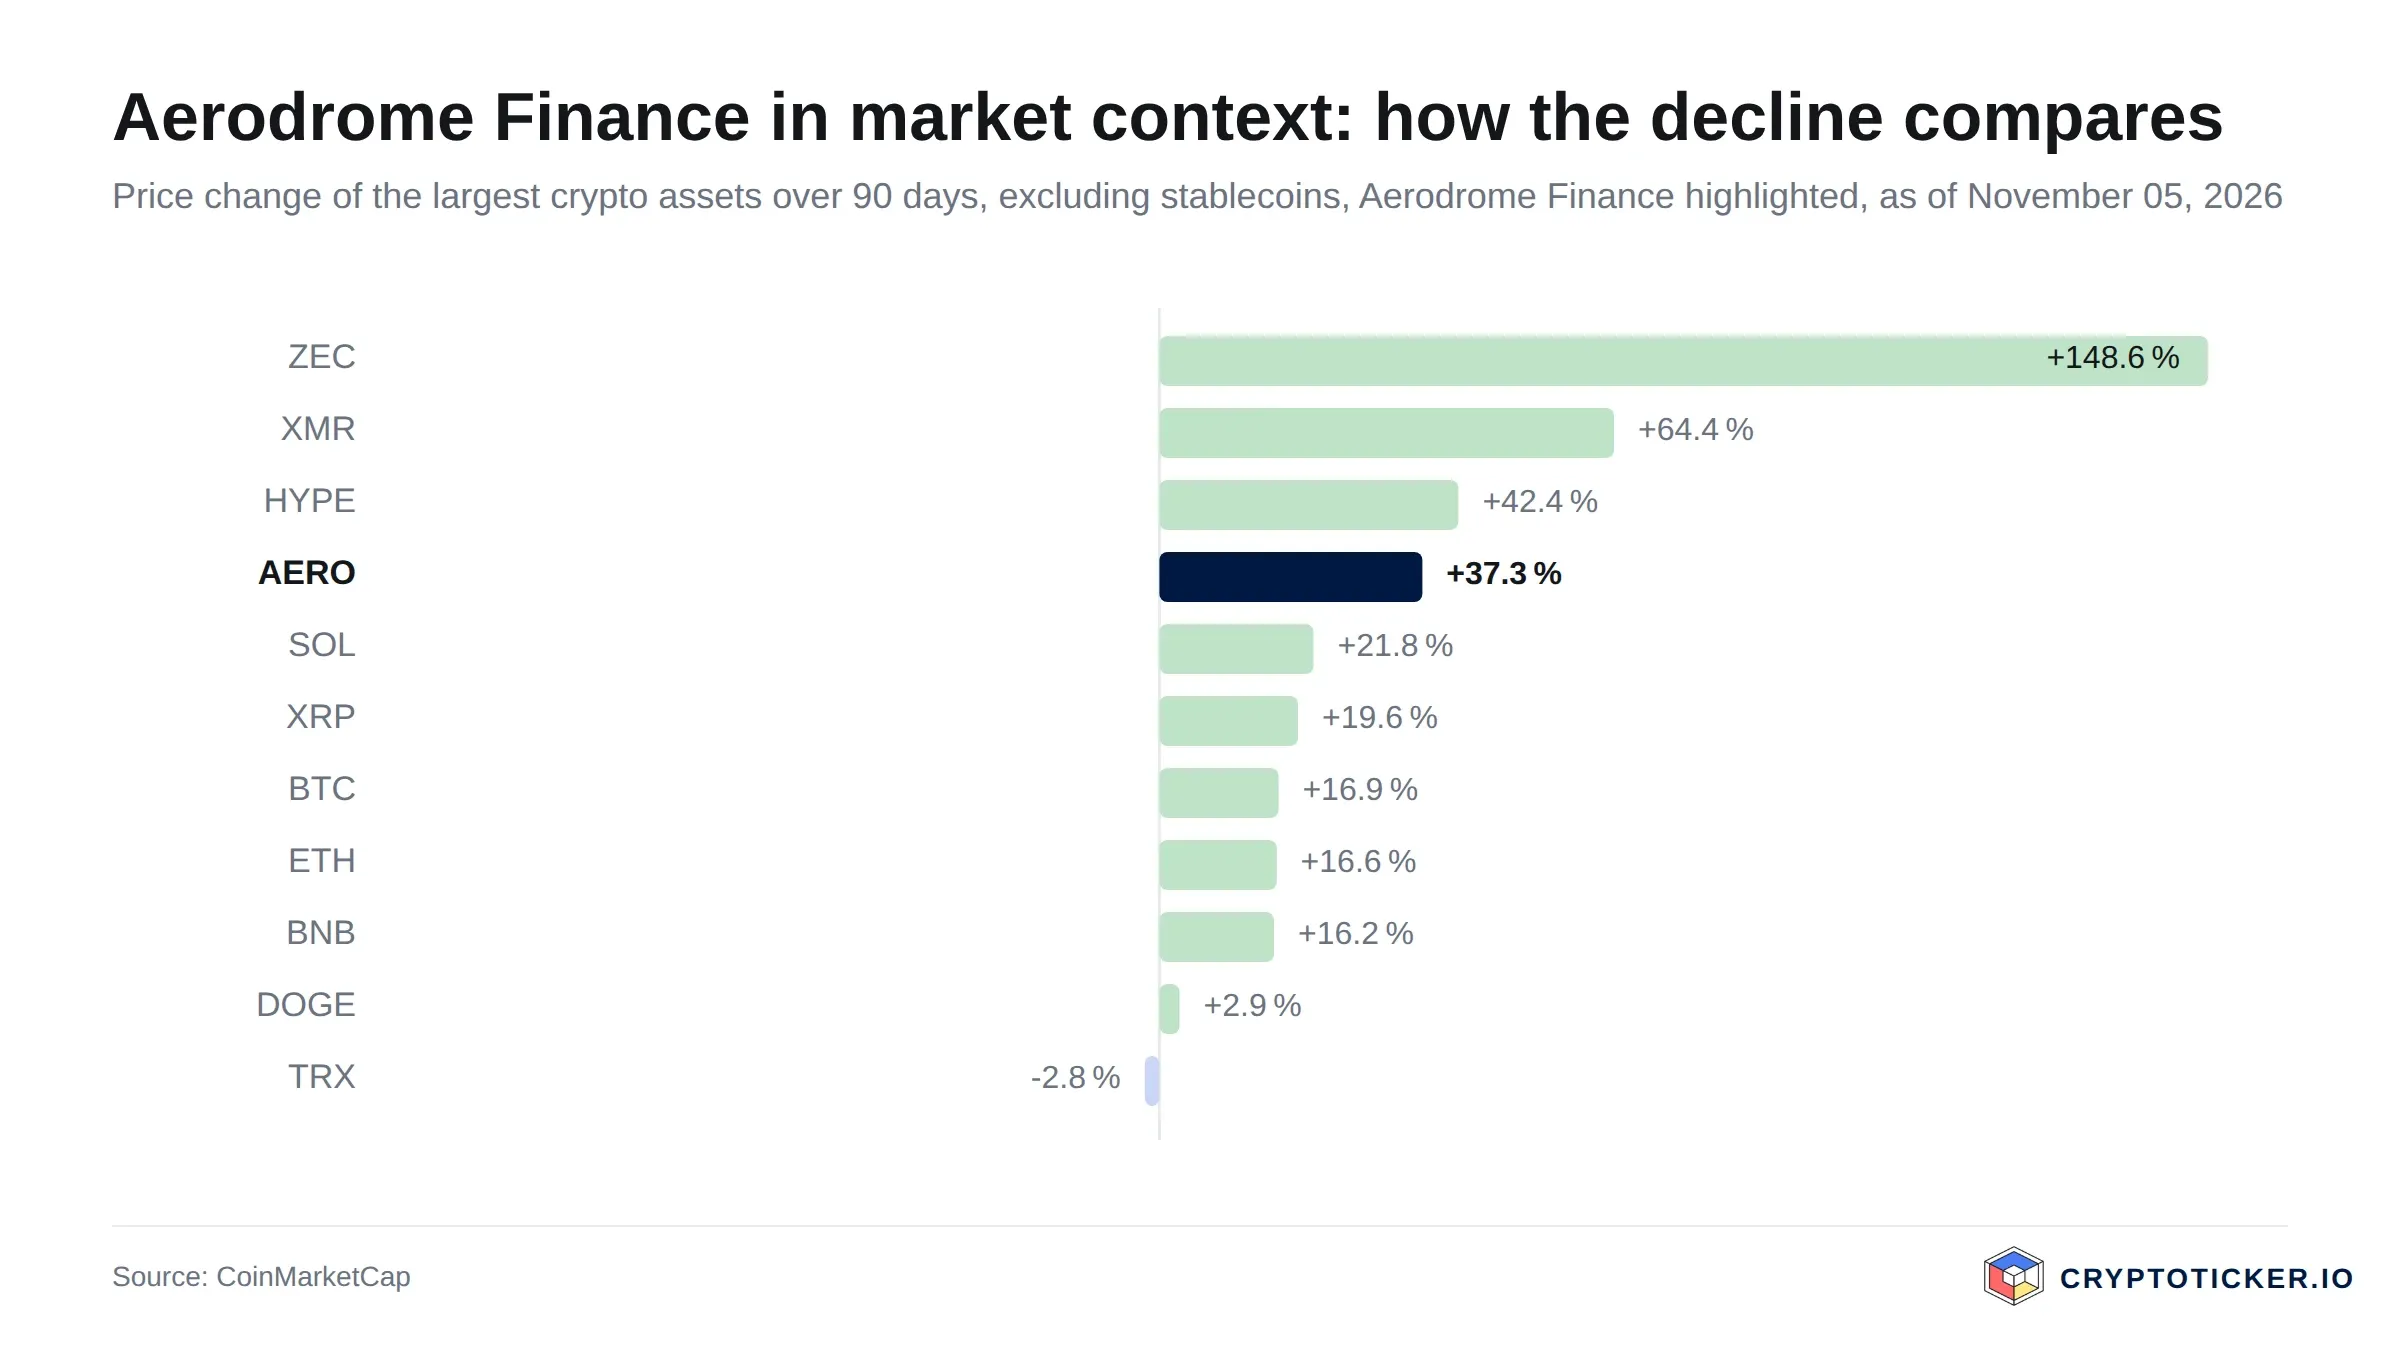
Second, ongoing dilution. AERO has no supply cap. Every week new tokens are added as rewards for liquidity providers, and many recipients sell them, which keeps a steady supply flowing into the market. Demand has to absorb that pressure before the price can rise sustainably.
Third, dependence on a single blockchain. Aerodrome's business stands or falls with Base. If trading migrates to other layer-2 networks or to rival exchanges within Base, fees fall and with them the incentive to lock AERO. On top of that comes the cautious mood in the wider market, with a Fear and Greed reading of 36, which has traditionally hit smaller tokens hardest.
How to buy Aerodrome Finance at current prices
There are two routes. The simpler one runs through a centralised crypto exchange that lists AERO; the provider's coin list shows whether the token is available. Our crypto exchange comparison sets out fees, spreads and listings side by side. If a MiCA licence matters to you, the comparison of regulated crypto exchanges shows suitable platforms, and our Kraken reviews describe how one large exchange performs in day-to-day use.
The second route goes directly on-chain: you buy ether on an exchange, send it to your own wallet on the Base network and swap it for AERO on Aerodrome. Network fees on Base are usually low, but you carry full responsibility for addresses, keys and token approvals. If you lock AERO as veAERO, your capital is tied up for the chosen period of up to four years.
For larger amounts, a hardware wallet that supports Ethereum and Base is the safer form of custody. Our hardware wallet comparison shows which devices qualify. Whichever route you take, add up the full cost: trading fee, spread, withdrawal fee and, where relevant, network fees.
Is Aerodrome Finance a good buy at current prices, then?
In the short term the decision lies between $0.586 and $0.72. If the 200-day average holds and AERO reclaims its 50-day average on a daily close, the correction since October would be over, and the October high of $0.94 would come back into view. If instead the price closes several days below $0.586, a return to the September low of $0.46 becomes the more likely scenario. Should that level fail too, the case for a recovery with rising lows is refuted.
In the long term the answer depends less on the chart than on Base. If trading on the layer-2 blockchain keeps growing and Aerodrome remains a central venue there, fees for veAERO holders can offset the continuous issuance of new tokens. If Aerodrome loses market share or volume shrinks for months, dilution will dominate. The long-term case is refuted if trading volume falls durably below its late-summer level while the price stays below $0.46. This is an assessment in scenarios, not a recommendation to buy.
Buying Aerodrome Finance: The key points for your decision
- Keep the three levels in view: $0.586 as the 200-day average, $0.72 as the 50-day average and $0.46 as the September low. The longer-term scenarios are in our Aerodrome Finance price prediction.
- Before buying, check which exchange lists AERO and what trading there costs. The exchange comparison puts fees and listings side by side.
- Settle custody before you buy, especially if you plan to hold AERO directly on Base. Suitable devices are in the hardware wallet comparison.
Disclosure: Some of the providers mentioned in this article work with us through affiliate programmes. This has no influence on the price analysis or the assessment of the chart; the price data come from a public market data source and can be verified there.
(As of 4 November 2026. This article is not investment advice. Prices, fees and terms change; check them with the provider before every purchase. Crypto assets are subject to high price volatility, and a total loss is possible.)
Frequently asked questions about Aerodrome Finance
Transparency note: This article was produced with the assistance of artificial intelligence and reviewed by our editorial team before publication. All figures and claims were checked against the primary sources linked in the text. The feature image was generated with AI.
Related articles
- Solana staking yields 5.2 percent while SOL has lost 19 percent in 30 days
- Solana Price Prediction: China's Central Bank Targets the Shanghai Campaign. What Now for SOL?
- Dogecoin Price at $0.072 in a Death Cross: When Will DOGE Rise Again?
- Bitcoin price prediction: $430 million outflow pushes the 2026 ETF balance below zero
- Ethereum price prediction: 986,847 ETH queue to stake while only 4,320 ETH wait to exit
Which topics should we dive deeper into?
Select what genuinely interests you. Your picks feed directly into our editorial planning.
Crypto news that's actually worth your time.
Weekly. 60 seconds. Carefully curated by our editors: no hype, no promo flood, no spam.

November 6, 2026 3:25 PM
Solana Price Prediction: Only $1.2 Million in ETF Outflows, Even Though Holders Are Under Water
Analysis: Solana fell 6.5 percent on Thursday, yet only $1.18 million left the US spot ETFs. Investors have paid in $1.467 billion since launch, while the funds' holdings are now worth $1.333 billion.
November 6, 2026 3:16 PM

Ethereum Price After the Jobs Report: 165,000 New US Jobs Sharpen Fears of a Fed Hike
Analysis: US payrolls grew by 165,000 in October, more than twice the forecast, and futures now put the odds of a Fed rate hike in December at around 80 percent. Ether sits at $2,236, its lowest level since August, as the 200-day line at $2,157 draws closer.

November 6, 2026 9:14 AM

Bitcoin Cash price drops 7.4 percent to $264, its lowest level since September 21
Bitcoin Cash has fallen to around $264, its lowest level since September 21, and is now holding only the 100-day line at $261. The decline follows a sell-off across the entire crypto market, amplified by liquidations of more than $1 billion.
November 6, 2026 7:19 AM

XRP Price Drops to $1.20 and Below Its 200-Day Line: What Is Going On With XRP?
XRP loses 8.3 percent and trades at its lowest level since August. The Wall Street sell-off meets ETFs without inflows and a surplus of long accounts in the futures market.
November 6, 2026 5:22 AM

Bitcoin price at $75,700: BTC trades below its 100-day line ahead of the US jobs report
Context: Bitcoin starts Friday at $75,692, a good $5,000 below Thursday's high and under its 100-day line. The US jobs report for October follows at 2:30 p.m. German time, and it will decide whether the 200-day line at $73,200 becomes the next target.
November 6, 2026 3:12 AM

Ethereum Price Falls 7.9 Percent to $2,237 After Seven Days of ETF Outflows
Analysis: Ether lost 7.9 percent in 24 hours to around $2,237 and fell harder than Bitcoin after a chip sell-off on the Nasdaq wiped out leveraged positions. The role of ETF outflows, the levels that matter now and what investors in Germany should consider on tax and buying.
November 6, 2026 1:17 AM

Chainlink Price Falls 7.6 Percent as Long Bets Grow: Will $10.26 Support Hold?
Chainlink lost 7.6 percent on November 5, falling to $10.69 as the Nasdaq sell-off dragged crypto lower. Yet on OKX the number of long accounts rose to as many as 2.59 per short account, and the 200-day line at $10.06 is moving closer.
November 5, 2026 9:12 PM

Solana Price Slides to $89, First Test of the 200-Day Line Since August
The Solana price fell 6.4 percent to around $89 on November 5 and touched its 200-day line for the first time since August. A chip sell-off on the Nasdaq set it off, amplified by more than $1 billion in liquidations and ongoing ETF outflows.
November 5, 2026 7:14 PM

Solana Price Prediction: SOL Sits on Its 200-Day Line as DEX Volume Hits $2.39 Billion
Solana trades at $89.19 on Thursday evening, right on its 200-day moving average at $88.93. Volume on decentralised exchanges on the Solana blockchain rose 26.8 percent on the same day, while network fees are 40 percent below the previous month.

November 5, 2026 1:09 PM

Cardano Price Prediction: Down 26.5 Percent in 30 Days, the Levels ADA Must Hold Now
Cardano lost 26.5 percent in 30 days, four times as much as Bitcoin. Now the 20-day and 200-day averages sit almost at the same price right above the market. Why this zone decides and which scenarios follow for ADA.
November 5, 2026 12:07 PM

Ethereum Price Prediction: 77,441 Puts for November 13, Then the Options Market Flips
Ether just gained 5.5 percent, yet the options market is split: for November 13 there are three times as many puts as calls, for November 27 twice as many calls as puts. What that means and which levels count now.
November 4, 2026 3:15 PM

Solana price prediction: SOL tests the 200-day line at $88.88 ahead of Breakpoint London
Analysis: eleven days before the Breakpoint conference in London, Solana fell to $89.77, almost touching its 200-day moving average. Our review of the last three conferences shows how strongly the price moved before and after.
November 4, 2026 11:18 AM
Bitcoin price prediction: DVOL drops to 37 after the election, will the 100-day line hold?
Analysis: after the US election night, the DVOL volatility index has fallen from 40.89 to 37.03 points. What the options market expects for the 100-day line at $76,663 ahead of Friday's $2.46 billion expiry.

November 3, 2026 8:59 AM

Ethereum Price Below $2,300: Is $2,000 Next or Is This the Bottom?
Ethereum price slips toward $2,250 as $3 billion leaves DeFi. Whales are buying the dip. Does ETH hold $2,200 or test $2,000 next?
November 2, 2026 9:36 PM

Bitcoin price prediction: $295 above the 100-day line, the level that decides
Analysis: the daily low was $295 above the 100-day line at $76,035. Four trading days before the US midterm elections and with an 82.6 percent rate expectation for December, this gap will decide the coming weeks.
November 2, 2026 7:30 PM

Chainlink slips below its 100-day line as long bets shrink by a third
Analysis: Chainlink trades at $11.11 and falls below its 100-day line at $11.36. At OKX the long-short ratio has dropped from 3.18 to 2.10 since October 24, and the 200-day line sits at $10.03.
November 2, 2026 7:13 PM

Solana price prediction: 1,000 days without an outage, will the 200-day line at $89 hold?
Analysis: the Solana blockchain has run without a halt since February 6, 2024, and on November 2 the streak reaches exactly 1,000 days. The price still falls to $92.78, its lowest since August; we show which levels matter now and why technology alone does not carry the price.
October 30, 2026 11:28 PM

Is Polygon a Good Buy at Current Prices?
Polygon sits roughly half below its twelve-month high and keeps running into both moving averages. What the chart structure, the RSI and the trading volume say about buying POL at the current price.
October 30, 2026 6:37 PM
XRP price prediction: will the price rise after $8.4 million of inflows?
Analysis: the US XRP funds took in a net $8.43 million on Thursday, the strongest daily figure of October. Why that sum still barely moves the price and which two levels count now.
October 29, 2026 9:44 AM

Cardano below $0.20: what delegators should watch now
Cardano trades at $0.1979 on Thursday morning, the first reading below the round mark since September 17. The 200-day line stands at $0.2100 and did not hold.
October 29, 2026 9:33 AM
Bitcoin Cash falls below $286: the 200-day line that decides the trend
Bitcoin Cash loses almost 6 percent to $279.87 and slips below its 200-day line at $286.19. The trigger is the Fed rate pause of October 28, at which two members even voted for an increase.
October 27, 2026 6:15 PM

Dogecoin price 13.9 percent below the 200-day average: a wider gap on 94 of 166 days
Where things stand: Dogecoin trades at $0.0778 on Tuesday afternoon, 13.9 percent below its 200-day average and 7.4 percent below its 50-day average. What the levels allow, and how often the gap was wider this year.
October 26, 2026 9:32 PM
Ethereum price prediction: the 200-day line is the level that decides
Analysis: Ethereum trades at $2,308 on Monday evening and falls for the fourth day in a row, below the 200-day average of $2,329 for the first time since August 20. Price, averages and the Fed date on Wednesday are documented; the editorial team's assessment stands separately in the text.
October 23, 2026 10:23 AM

XRP price prediction: the 100-day average crosses the 200-day average, 6.05 billion XRP move onto exchanges: what matters now
Our reading: on October 21 XRP's 100-day moving average rose above its 200-day average, the first time in our measurable series since May 11. Over the same stretch exchanges took in 6.05 billion XRP, and the two numbers point in different directions.
October 5, 2026 4:33 PM

Cardano at a three-month high, the golden cross fell on October 1: the last one ended 42.4 percent lower
ADA stands at $0.27, its highest in three months, and the trade press traces the jump to a golden cross. Our own analysis of 721 daily candles shows two things the reports miss: the signal is four days old, and the last one ended 42.4 percent lower.
September 20, 2026 1:11 PM

Bitcoin Golden Cross: What Twelve Signals Since 2014 Really Show
Bitcoin's 50-day line has crossed its 200-day line. We evaluated all twelve golden crosses since 2014 ourselves and measured what happened afterwards. The result argues against the common reading of the signal.

More from CryptoTicker