
Is Bitcoin a Good Buy at Current Prices?
Bitcoin trades about a third below its twelve-month high and has reclaimed both moving averages. What chart structure, RSI and trading volume say about buying at current prices.





Which topics should we dive deeper into?
Select what genuinely interests you. Your picks feed directly into our editorial planning.
Crypto news that's actually worth your time.
Weekly. 60 seconds. Carefully curated by our editors: no hype, no promo flood, no spam.
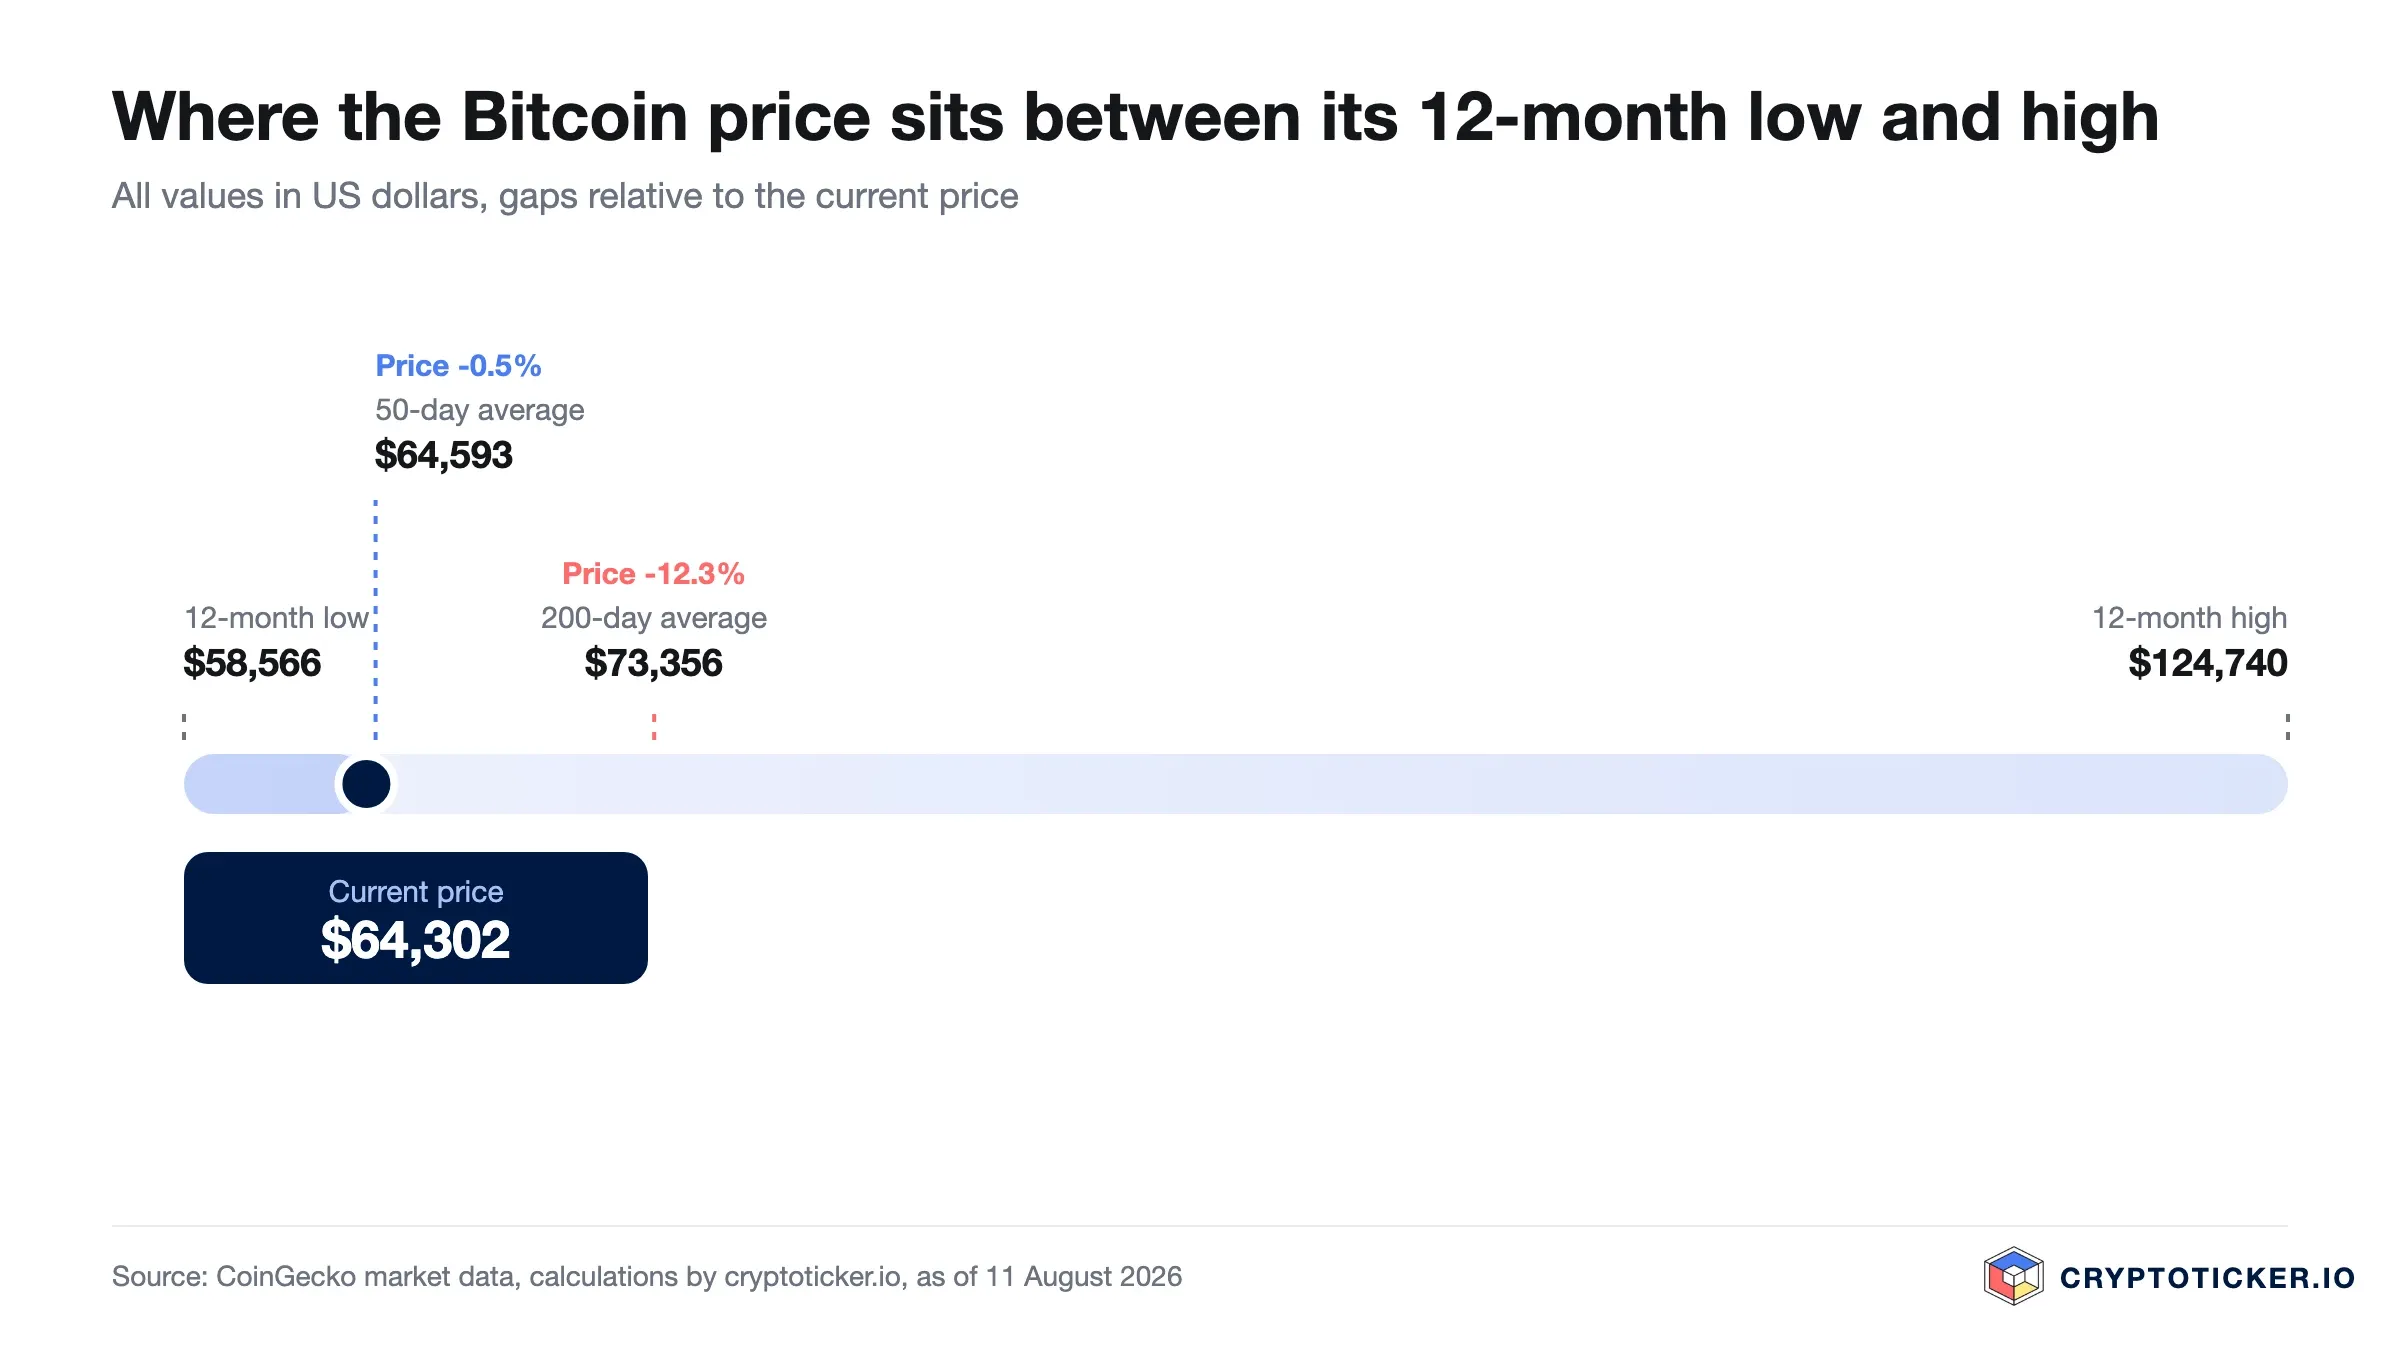
Bitcoin trades at roughly $84,946 on 4 October 2026. That is about 32 percent below the twelve-month high of $124,740 and close to 31 percent below where it stood a year ago. At the same time, the price sits some 45 percent above the twelve-month low of $58,566, reached at the turn of June and July.
Which raises the question that gets asked after every strong recovery: is this still an entry price, or one that has already run? This article does not answer it with a number. It answers it with the chart structure, the demand side, and the two conditions under which buying at current prices has any logic at all.
The price data in this article was compiled by cryptoticker.io on 4 October 2026. It is based on daily closing prices for the past 365 days taken from CoinGecko; moving averages and the relative strength index were calculated from that series using the standard formulas. Anything beyond the data is marked as assessment.
Bitcoin price analysis: where does the Bitcoin price stand in October 2026?
The most important line for anyone considering an entry is the 200-day moving average. It sits at $75,466, leaving the price 12.6 percent above it. That configuration is the textbook case of a reclaimed uptrend: the price has taken back from below the line it spent half a year underneath, and has held above it since.
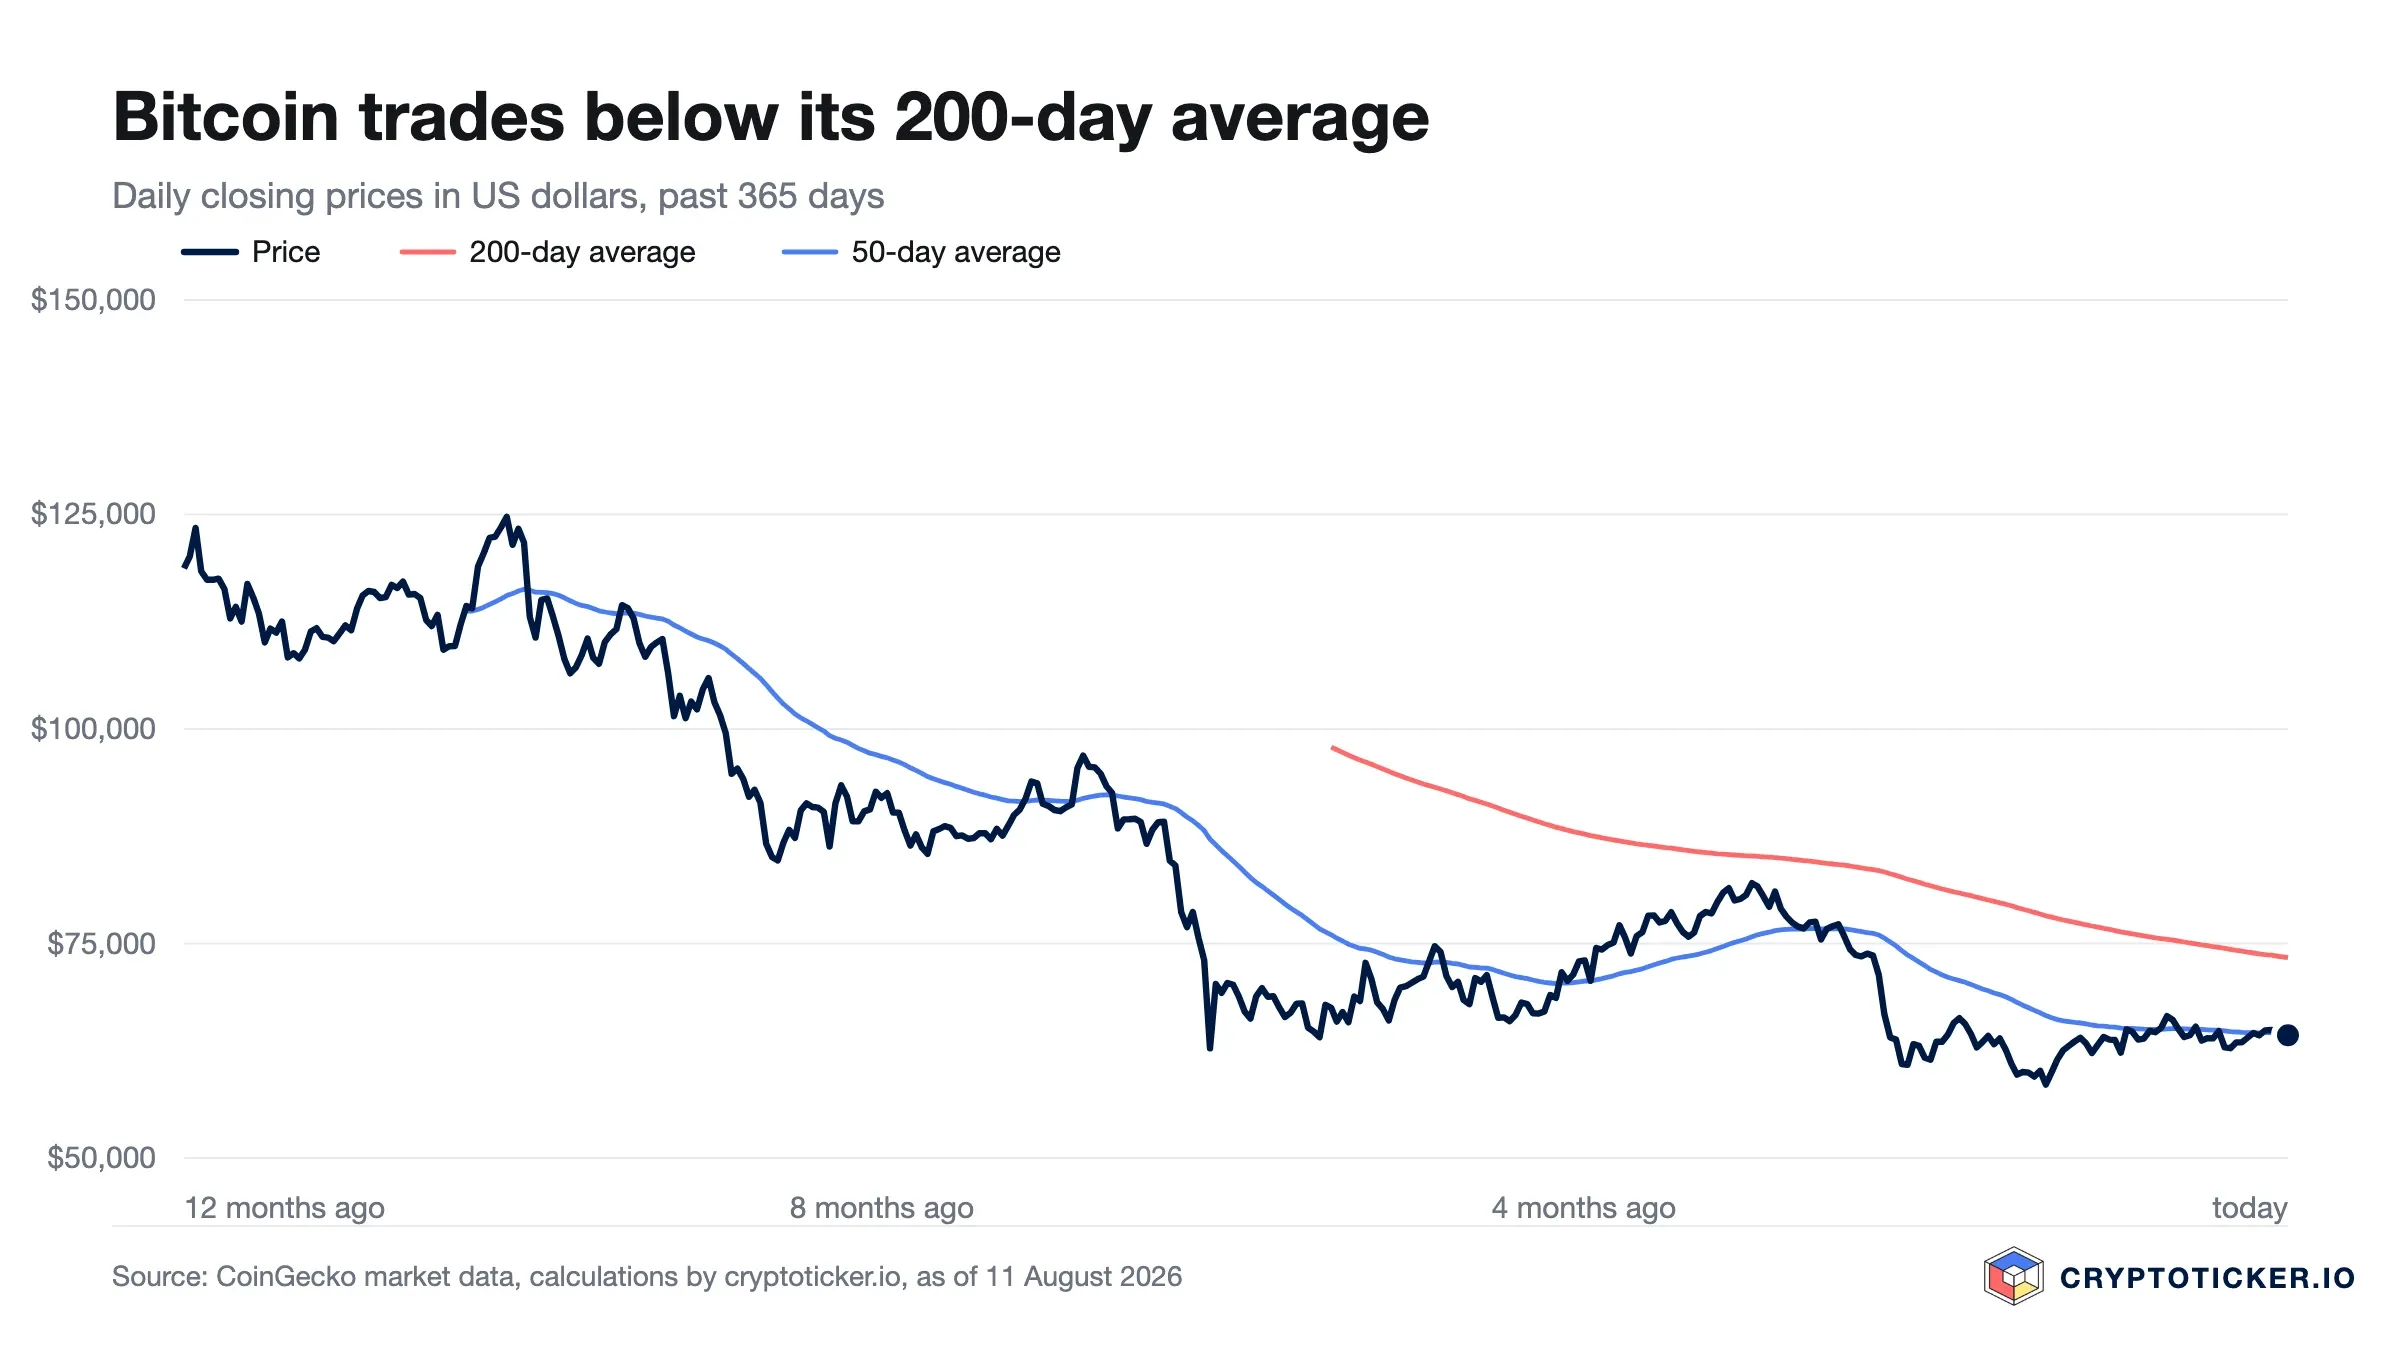
The 50-day moving average confirms that picture. It stands at $78,812, and the price is 7.8 percent above it. Both lines now run below the price, and the 50-day average has pushed 4.4 percent clear of the 200-day average. That is the real finding of these weeks: the summer's sideways phase has turned into an uptrend in which the short-term and medium-term direction agree — and the crossover has firmed up further since the end of September.
The levels are therefore clearly distributed:
- Support: the zone between $78,812 and $75,466, where the 50-day and 200-day averages run. This is where the new trend has to prove itself first.
- Second support: $58,566, the twelve-month low from the turn of June and July, roughly 31 percent below the current price. Below that, the chart offers open ground.
- The decisive hurdle: $124,740 at the twelve-month high. Reaching it requires roughly 47 percent; only above it would the recovery have become a new record.
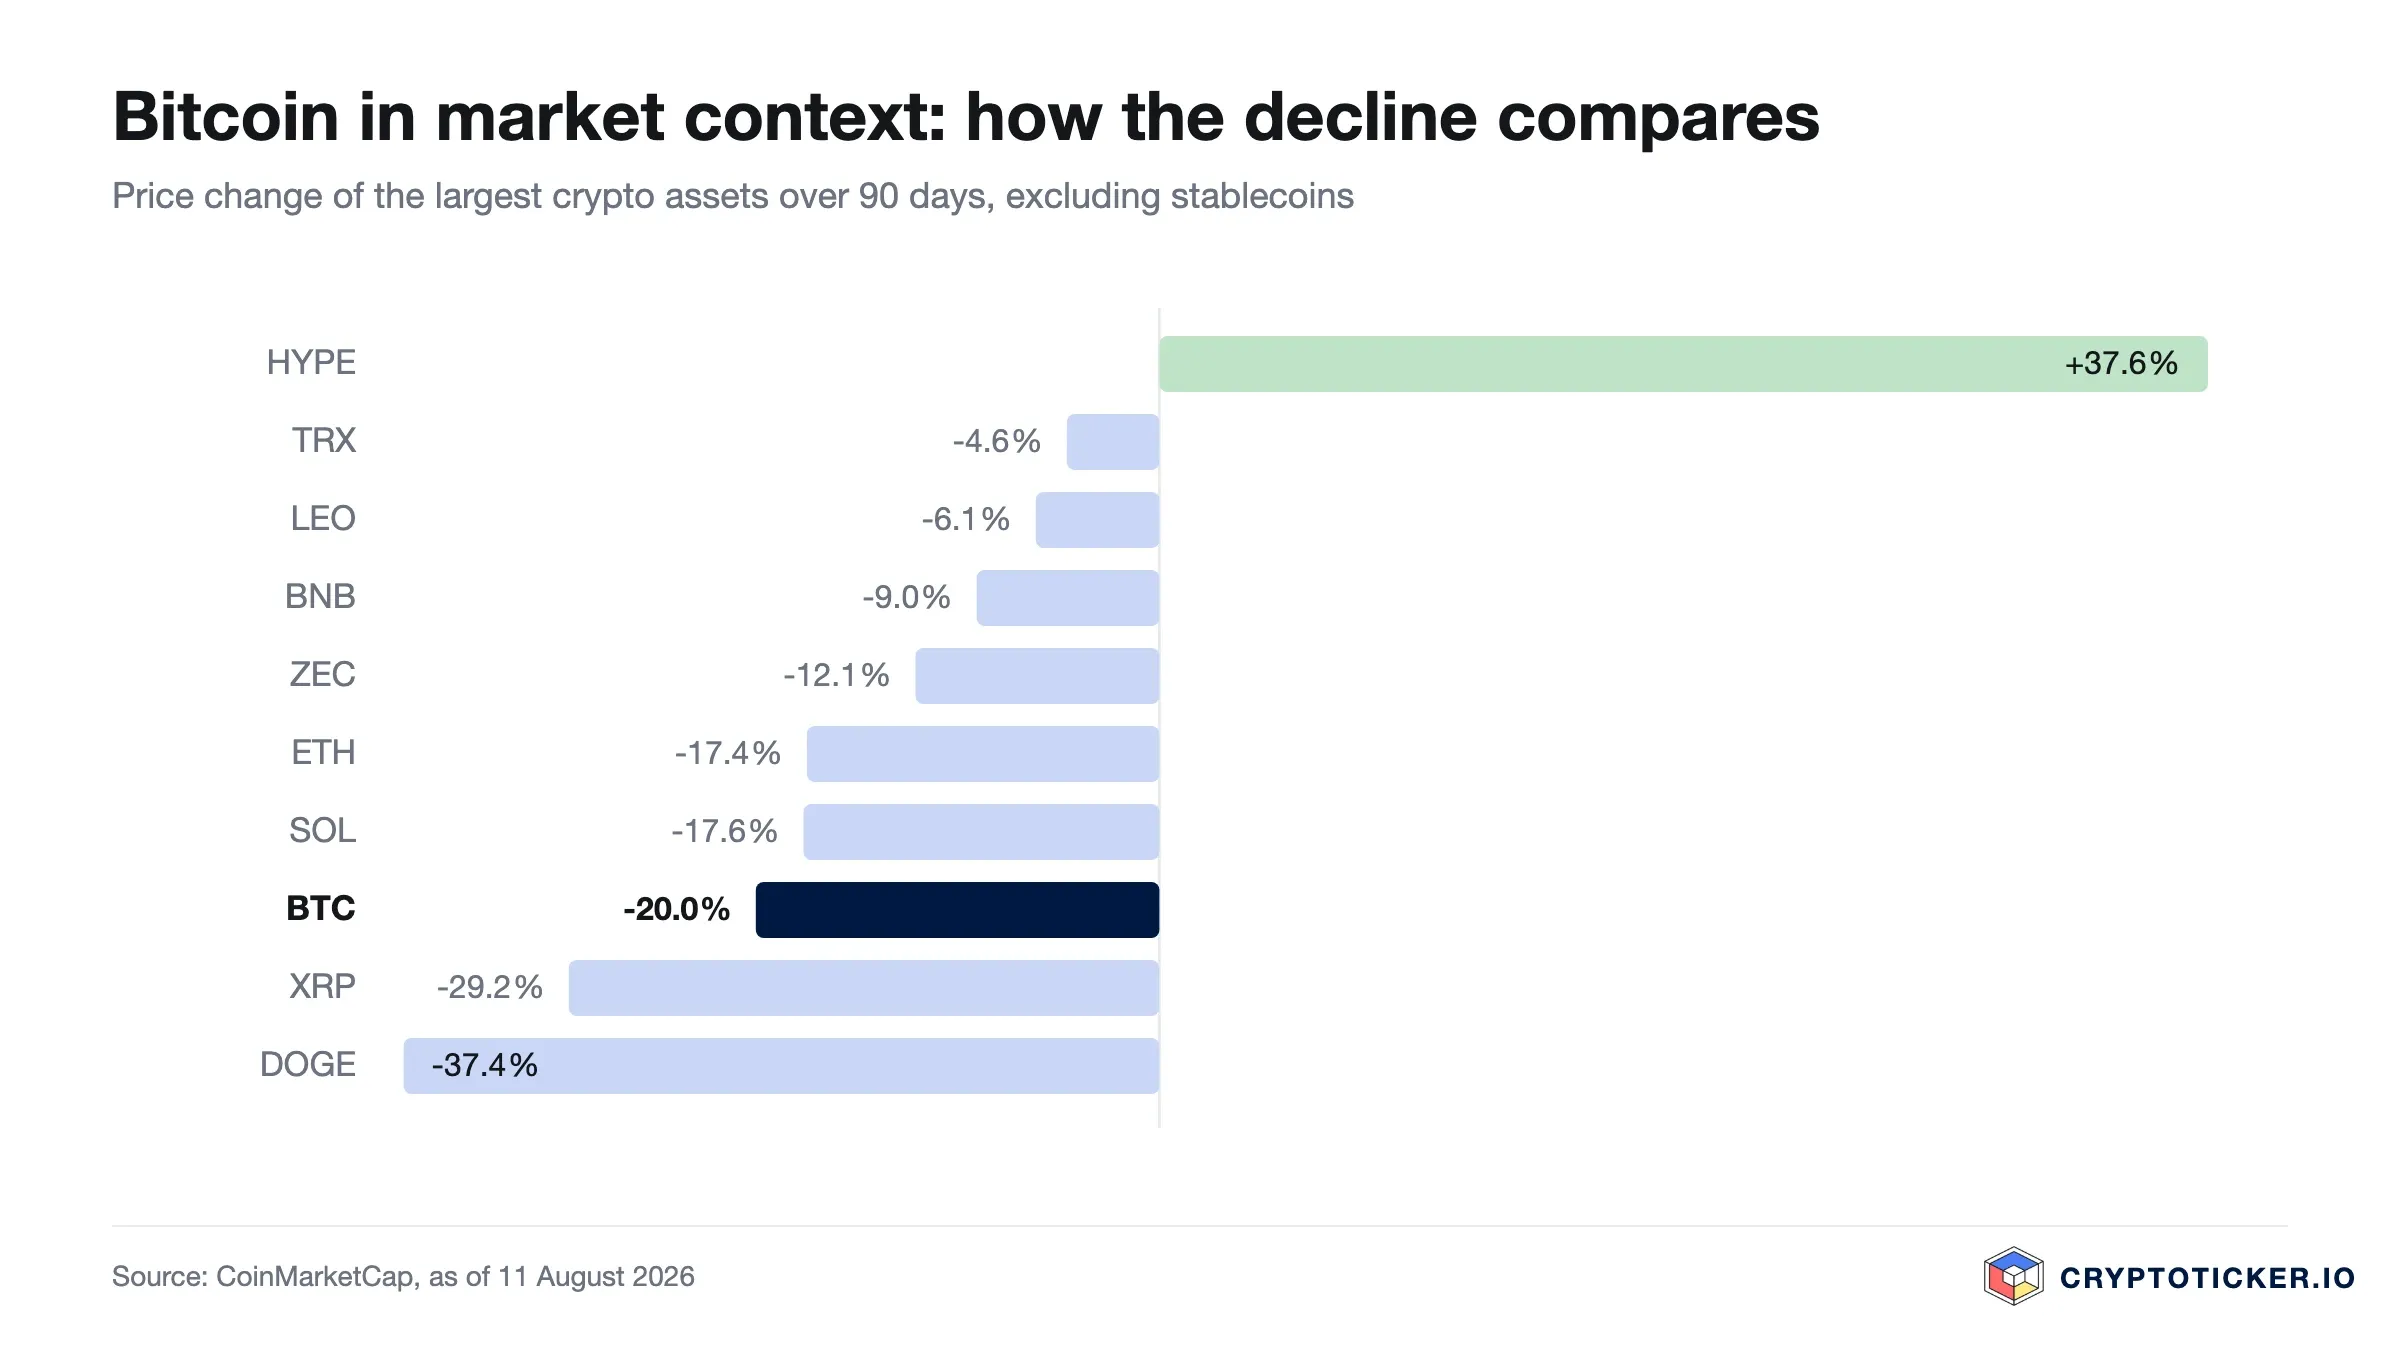
Over 30 days the price is up 6.6 percent, over 90 days it is up 32.7 percent. The market has gained substantial ground since early summer. Over a full year a loss of 31.2 percent still stands: the recovery has not yet made up for the crash.
Is the Bitcoin uptrend durable or merely a counter-move?
For a buyer this is the most expensive question of all, and the data now gives a considerably friendlier answer than it did in summer. Three conditions would have to be met for a durable trend change, and all three are — one of them only weakly.
First, the price would have to clear the 200-day average from below and hold above it. That has happened: it trades 12.6 percent above the line and has held there since 20 August. Second, the 50-day average would have to cross the 200-day average from below. That happened too, on 20 September, and the gap has since widened from under one percent to 4.4 percent: $78,812 against $75,466. Third, such a breakout would have to come with rising trading volume. This is the weakest of the three points, and it is examined in detail below.
What exists is therefore more than the summer's stabilisation, but less than an established bull market. The summer low has never been retested, and the price has moved 45 percent away from it. The gap between the two averages, however, is still only 4.4 percent, and the crossover is two weeks old: a sharp correction can undo it. Historically, fresh trend changes like this resolve in both directions.
Why the RSI currently decides the Bitcoin price
The price has pulled clearly away from its 50-day average, and the relative strength index shows by how much: at 64.4 it sits well above the midline, but still below the level of 70 at which a market counts as overbought.
That number matters more for the buying decision than it looks. An RSI of 64.4 means Bitcoin is neither oversold nor overbought, but inside a live upward impulse; against the end of September the indicator has moved further towards the overbought mark without reaching it. That removes the most popular argument for a contrarian entry. At the summer low the reading was considerably lower, and precisely that sell-off produced the move the price has run since. Buying now means buying a trend that already stands 45 percent above its low, not a capitulation.
The practical boundary follows from this: the zone between $78,812 and $75,466, where both averages run, is where it is decided whether the trend holds. A drop back below it would reverse the configuration described in this article.
What trading volume reveals about Bitcoin demand
This is the weakest part of the current picture. Average daily volume over the past seven days was roughly $30.5 billion. Measured over 30 days it was $30.9 billion. Volume therefore sits 1.1 percent below its monthly average — it has not risen further since the end of September but fallen back to the monthly mean.
That combination is the weak spot in an otherwise friendly picture. A breakout that holds usually forms when turnover picks up noticeably alongside the price, because new capital is entering the market. When the price gains 33 percent over 90 days while volume stalls at its monthly mean, the advance is carried by comparatively little trading.
In our assessment, that is why the breakout is confirmed but not secured. A price only holds once enough market participants are willing to pay it. That willingness shows up in volume, and right now it is growing only slowly.
Which structural factors support the Bitcoin price long term
Against the weak chart stands the supply side, and for Bitcoin that side is unusually well documented. The cap of 21 million units and the halving of issuance at fixed intervals are written into the protocol and described in the original Bitcoin whitepaper. Unlike almost every other crypto asset, this commitment does not require trusting a company. It can be read in the code.
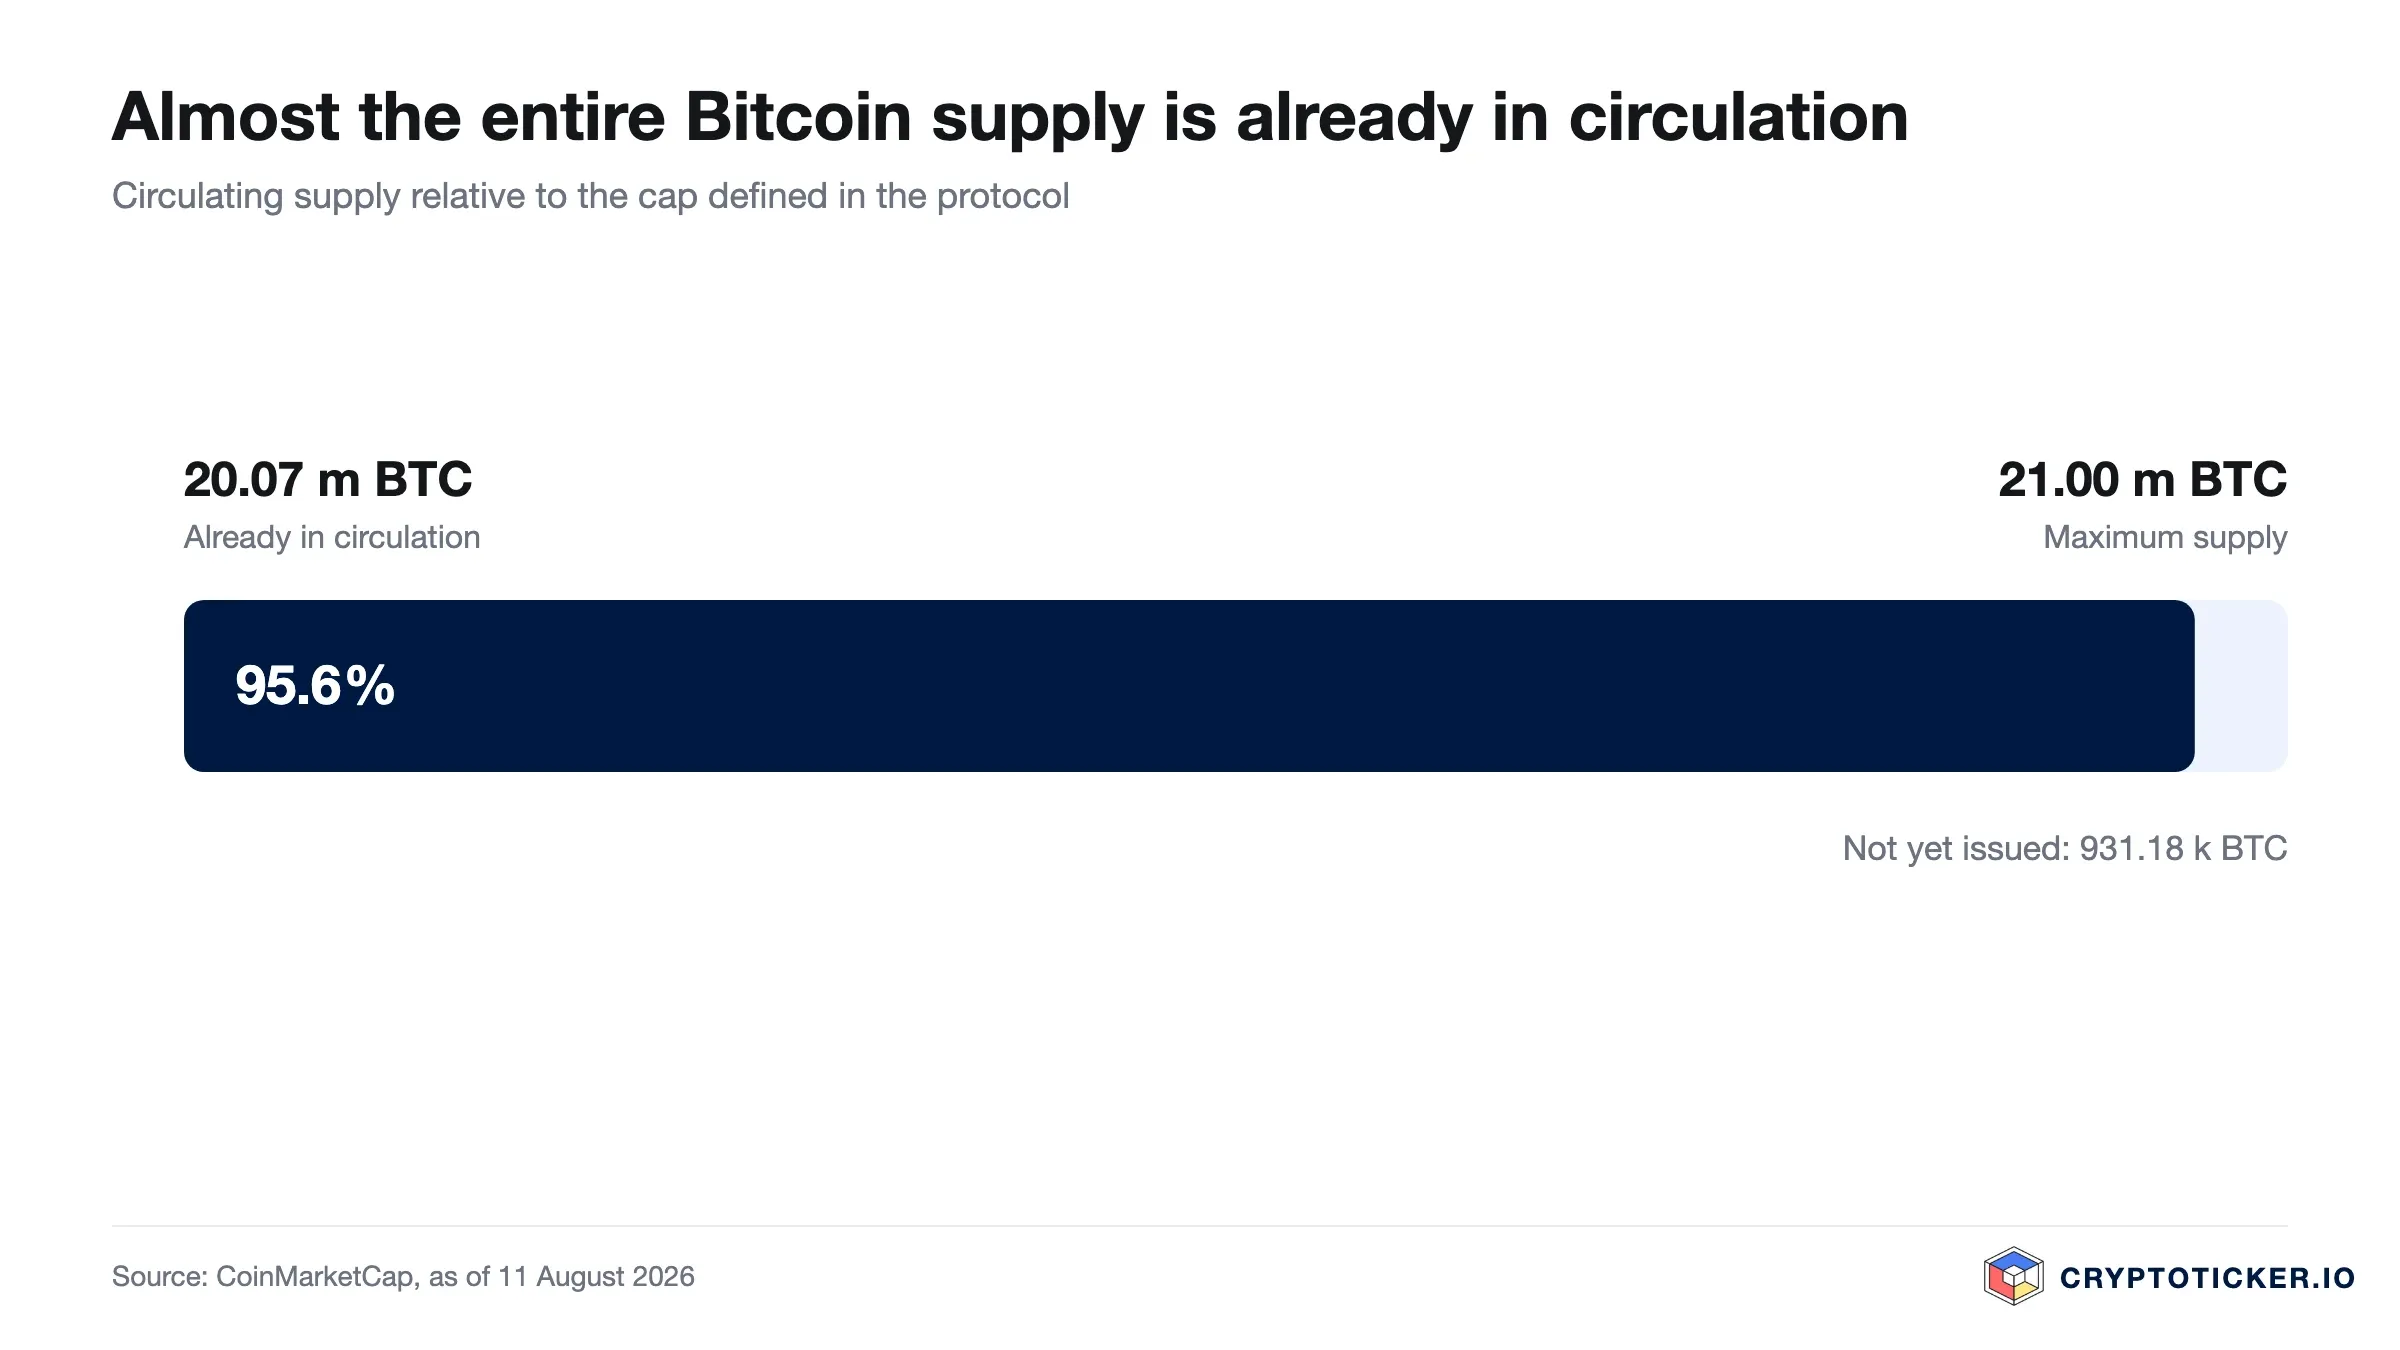
That is the core of the long-term argument: new issuance declines on a fixed schedule while demand fluctuates. During a recovery this works mostly in the background, because the supply setting the price comes from existing holders selling rather than from new issuance. Over multiple years, however, this mechanism has proven the most stable factor in the entire crypto market.
The second structural point is regulation. Under the European markets in crypto-assets regulation, trading venues in the EU face uniform licensing and custody obligations, and the supervisor lists authorised firms in the public register of the European Securities and Markets Authority. For a buyer this means counterparty risk is easier to contain today than in any earlier cycle. For a detailed view of which venues meet those requirements, see our comparison of regulated crypto exchanges.
What argues in favour of buying Bitcoin at current prices
Three points can be defended on the evidence. The first is the reclaimed trend. The price trades above both averages, and the 50-day average has crossed the 200-day average from below. In previous cycles this configuration has opened the longer upward phases. That is a historical observation, not a guarantee, because a crossover this fresh can also unwind.
The second is the support that has held. The summer low at $58,566 has not been tested since, and the price now stands 45 percent above it. As long as that level holds, downside risk is definable, and a definable risk is the precondition for any sensible position size.
The third is the time horizon. Anyone buying across several years is not buying this price but an average of many prices. That is exactly what savings plans are built for. Which providers offer automated Bitcoin purchases with transparent accounting is set out in our savings plan comparison.
What argues against buying Bitcoin at current prices
Three points again, and they carry less weight than in summer without having disappeared. The price has risen 33 percent in 90 days; buying today means buying after a move rather than before it. The RSI at 64.4 provides no contrarian case, because nothing is oversold any more. And volume that has stalled suggests the advance is carried by comparatively little new capital.
Then there is the shrinking distance to the downside. The two averages are about eight to thirteen percent away, the twelve-month low roughly 31 percent. The twelve-month high still requires roughly 47 percent. A buyer at today's level therefore has considerably less safety margin beneath them than in summer.
If you want to read the longer-term scenarios along with their assumptions and weightings, they are laid out in our Bitcoin price prediction. It discloses which methods enter the scenarios at which weight, and where the calculation can fail.
How to buy Bitcoin at current prices
Once the decision to enter has been made, the key question shifts from price to execution. Three things shape the outcome more than the entry date does.
First, total cost. Trading fee, spread and withdrawal fee add up, and with small recurring amounts the spread weighs more heavily than the advertised order fee. An overview of the terms is available in our buy Bitcoin comparison, which ranks providers by cost, regulation and custody.
Second, custody. Anyone planning to hold for years should know whether the coins stay with the provider or can be moved to a personal wallet, and what such a transfer costs. Not every platform permits withdrawals to an external wallet.
Third, the provider itself. For the European market, licensed venues with audited fee models and custody practices are the relevant candidates. Our detailed assessment of one EU-regulated provider is in the Bitpanda review, including scores for cost, usability and support.
So is Bitcoin a good buy at current prices?
For a short-term entry, the answer based on today's data is a qualified yes. The technical conditions that were missing in summer are now in place: the price trades above both averages, and those averages have crossed. What is missing is volume that clearly confirms the move, and a price level that does not already stand 45 percent above the yearly low.
For a long-term, staggered build-up the answer is the same as in summer, only at a higher price. The level still sits about a third below the high, support at $58,566 is holding, and the supply mechanism is unchanged. Anyone thinking in years, buying in tranches and able to tolerate a drop back to the averages is no longer buying the sell-off today, but neither are they buying the top.
The decision therefore depends less on the price than on two questions you have to answer for yourself: how long can you hold the position, and how much drawdown can you take without selling? If you have no clear answer to either, the correct position size is zero, regardless of the chart.
Buying Bitcoin: what to take away
- Use the 200-day average at $75,466 as your trend marker, not the daily price. While Bitcoin trades above it, the uptrend stands; a drop back below would call it into question again. The resulting scenarios and the assumptions behind them are set out in our Bitcoin price prediction.
- Decide on your time horizon first, then on the entry. Short term the technical conditions are met but only weakly confirmed; long term the level remains defensible. For staggered purchases across months, savings plans are the appropriate instrument, and the terms are in our savings plan comparison.
- Check cost, custody and licensing before placing the first order. Over long holding periods, the fee model and withdrawal options determine returns more than a few percent on the entry price. Our comparison of regulated crypto exchanges shows which providers meet the European requirements.
Disclosure: Some of the providers mentioned in this article work with us through partner programmes. This has no bearing on the price analysis or the assessment of the chart; the price data comes from a public market data source and can be verified there.
(As of 4 October 2026. This article is not investment advice. Prices, fees and terms change; check them with the provider before every purchase. Crypto assets are subject to high volatility and a total loss is possible.)
Transparency note: This article was produced with the assistance of artificial intelligence and reviewed by our editorial team before publication. All figures and claims were checked against the primary sources linked in the text. The feature image was generated with AI.
Related articles
Which topics should we dive deeper into?
Select what genuinely interests you. Your picks feed directly into our editorial planning.
Crypto news that's actually worth your time.
Weekly. 60 seconds. Carefully curated by our editors: no hype, no promo flood, no spam.

August 24, 2026 12:50 AM
Is Bitcoin Cash a Good Buy at Current Prices?
Bitcoin Cash has rallied hard off its June floor, but it still trades below its long-term trend line with the RSI stretched. We work through what speaks for and against buying BCH at current prices.

July 17, 2026 7:55 PM
Is XRP a Good Investment in 2026? Price Analysis and Prediction
XRP has broken out of its summer range and is holding above its 200-day average — without the catalyst the market waited a year for. What the chart, the CLARITY Act and 2026 forecasts really say.
August 27, 2026 2:21 AM

Is SUI a Good Buy at Current Prices?
SUI has reclaimed its 200-day moving average and trades 79 percent above its twelve-month low. We check whether the coin is a good buy at current prices.

May 13, 2026 11:02 AM

Is PEPE Coin worth Buying in 2026?
PEPE has reclaimed both its 50 day and its 200 day average, with trading volume back at its yearly norm. What that means for anyone buying at current prices, and the two levels that settle it.
January 26, 2026 10:50 AM

Bitcoin Price Prediction: BTC Breaches $88K Support and Faces Potential Downside
Bitcoin has dropped below the critical $88,000 support level on January 26, 2026. Market indicators suggest a risk of further declines amid global macro uncertainty.
September 23, 2024 8:44 AM
Is it a Good Idea to Buy XRP below $0.60?
With recent XRP price drops positioning it below the $0.60 mark, investors are left pondering. Is it a good idea to buy XRP below $0.60?
February 11, 2026 7:05 AM
5 Things to Look for BEFORE Buying Bitcoin
Thinking about entering the crypto market? Discover the 5 essential factors to check before you buy Bitcoin to secure your investment and strategy.
June 5, 2024 5:03 PM

Crypto Market Up: Bitcoin Breaches $71K, Altcoins Follow Suit, Eyes on New Highs
Cryptocurrencies are experiencing a surge, with Bitcoin leading the charge by surpassing $71,000. This bullish trend extends to altcoins, igniting optimism across the market. Will Bitcoin reach new highs?
September 28, 2026 4:28 AM

Is Quant a Good Buy at the Current Price?
Quant has broken out sharply after a mandate in US payments and stands at its highest level in twelve months. Is QNT a good buy at the current price? We examine the chart situation, volume and supply mechanics with our own data.
August 13, 2026 8:19 AM

SpaceX Stock Up 40% in 5 Days: SPCX Adds $530 Billion as Musk Bets the Company on AI
SPCX has ripped 40% higher in five sessions, adding roughly $530 billion in market value. Here is what is driving it and what the chart says next.
May 10, 2026 1:29 PM
Solana Price Eyes $100 Breakout as Bitcoin Solidifies Gains Above $80k
Solana (SOL) targets the $100 psychological level while Bitcoin (BTC) holds firmly above $80,000, signaling a major shift in the 2026 crypto market structure.
August 27, 2026 4:31 AM

Is AAVE a Good Buy at Current Prices?
AAVE has worked its way back above both the 200-day and the 50-day moving average, yet still trades far below its twelve-month high. Using our own price data, we examine what speaks for and against an entry at current prices.
August 27, 2026 3:24 AM

Is Hedera a Good Buy at Current Prices?
HBAR has bounced off its twelve-month low but still trades well below its long-term average. We weigh moving averages, RSI and volume to judge whether Hedera is a good buy at the current price.
August 16, 2026 12:21 PM

Is Toncoin a Good Buy at Current Prices?
Toncoin has reclaimed both of its moving averages and now goes by the name Gram. We weigh what the chart, the RSI and the recovery in trading volume say for and against buying at current prices.
December 10, 2024 12:30 AM

Bitcoin Price Drops Below $100K – Is a Bigger Crash Coming?
Bitcoin has fallen below $100K, triggering a broader market correction of over 8% in the last 24 hours. With profit-taking and large sell-offs hitting the market, could Bitcoin drop to $90K or lower?
April 22, 2026 9:11 AM
Bitcoin Price Hits $78,000 as Ceasefire Extension Ignites Bullish Momentum
Bitcoin breaches $78,000 following the US-Iran ceasefire extension and a $2.5 billion MSTR purchase. Here is the weekly BTC chart for key 2026 price targets.
July 27, 2024 2:34 PM

Why Is The Crypto Market Up TODAY?
With the Bitcoin 2024 Conference taking place now in Nashville, the crypto market is showing bullish signals, intriguing traders around the future of Bitcoin and Altcoins.
August 23, 2026 1:16 AM

Is PEPE a Good Buy at the Current Price?
PEPE is back above both moving averages and the 50-day has crossed the 200-day. Is the memecoin a good buy at the current price, or is the rally already running on thin volume?
June 17, 2026 9:41 AM

SpaceX vs Bitcoin: Which Was the Better Investment?
SpaceX stock vs Bitcoin: who actually won? See what investing at SpaceX's launch versus buying Bitcoin a year ago would be worth today.
August 24, 2026 12:34 AM

Is Monero a Good Buy at Current Prices?
Monero holds above both of its long-term averages after a strong summer, yet still trades far below its twelve-month high. We look at what the trend, the turnover and the regulatory picture mean for anyone weighing a purchase of XMR now.
August 24, 2026 12:19 AM

Is Zcash a Good Buy at Current Prices?
Zcash has run far ahead of its own long-term averages after a week that changed the chart. We look at what the trend, the RSI and the turnover actually support, and under which conditions the case for buying ZEC breaks down.
March 29, 2026 2:07 PM

Is Ethereum a Good Store of Value?
Is Ethereum a reliable store of value? We analyze ETH price history, the "ultrasound money" narrative, and its long-term potential for 2026 and beyond.
February 19, 2025 1:00 PM

Dogecoin Price Prediction: Here's Why DOGE Price is a Good Buy Today
Dogecoin is gaining traction as ETF speculation grows. Could this be the next big move for DOGE investors? Is Dogecoin a good buy at today's price?
March 11, 2026 8:31 AM
Why is Bitcoin Moving Sideways? 3 Reasons for the BTC Price Consolidation
Bitcoin has dropped only 0.9% this month but remains trapped in a range. Here's why BTC is moving sideways and how traders are profiting from 63K to 73K.
September 11, 2026 8:32 AM
Bitcoin Price Drops 4% in a Week, and the Chart Just Got Interesting
Bitcoin price fell 4% this week and lost the $78,000 shelf. Here is what the chart says about the next support, resistance and price targets.

More from CryptoTicker