
Is SUI a Good Buy at Current Prices?
SUI has reclaimed its 200-day moving average and trades 79 percent above its twelve-month low. We check whether the coin is a good buy at current prices.





Which topics should we dive deeper into?
Select what genuinely interests you. Your picks feed directly into our editorial planning.
Crypto news that's actually worth your time.
Weekly. 60 seconds. Carefully curated by our editors: no hype, no promo flood, no spam.
SUI trades at around 1.1694 US dollars on 1 October 2026. That is 67.8 percent below the twelve-month high of 3.6285 US dollars set on 7 October 2025. At the same time the price sits 79.5 percent above the twelve-month low of 0.6514 US dollars marked on 19 August 2026, and it has reclaimed the 200-day moving average. Two numbers, two very different stories about the same coin. Is SUI a good buy at current prices?
The price data in this article was collected by cryptoticker.io on 1 October 2026, from the daily closing prices of the past 365 days. Moving averages, the relative strength index and the distances to the twelve-month high and low are calculated from that series using standard formulas. Every value refers to this snapshot and shifts with each trading day.
SUI Price Analysis: Where the SUI Price Stands and Which Levels Matter
The SUI price has gained 15.4 percent over the past seven days. In the last 24 hours it added 0.6 percent, so the move did not come from one single session. Over 30 days SUI shows a gain of 62.1 percent, over 90 days a gain of 52.0 percent, and over twelve months a loss of 67.4 percent. The time frame you pick decides which SUI you are looking at.
Three levels structure the picture. The first is the twelve-month low at 0.6514 US dollars, the most recent support the market has actually tested, and it has held. The second is the 50-day moving average at 0.8864 US dollars, 31.9 percent below today's price. The third is the 200-day moving average at 0.9637 US dollars. In August it still sat roughly a fifth above the price; today it lies 21.3 percent below it. The line where a recovery turns into a trend reversal has therefore been crossed.
With a market capitalisation of roughly 4.79 billion US dollars, SUI ranks 28th in the overall market. Of the 10 billion tokens the supply is capped at, 4.10 billion are in circulation, a good 41 percent. Readers who want the longer horizon rather than the current snapshot will find it in our SUI price prediction.
Is the SUI Downtrend Broken or Only Interrupted?
For a buying decision the distinction matters more than the size of the bounce, and the data has turned since the summer: the downtrend is damaged, and the first of the two conditions for calling it broken is met. The price has reclaimed the 200-day moving average at 0.9637 US dollars and trades 21.3 percent above it at 1.1694 US dollars. What is still missing is proof that the line holds as support on a retest.
What has actually happened is more than a reflex. The price marked a new twelve-month low on 19 August 2026, rebounded from there at speed, and then extended the move for six weeks instead of handing it back. A recovery that carries 62 percent over 30 days and takes the long-term average along the way is not merely selling pressure running out.
The structure of the twelve-month chart nevertheless remains a chain of lower highs. From the peak at 3.6285 US dollars in October 2025 the price stepped down through 2026 until the August low. That pattern only changes once SUI sets a high above the previous one and holds the 200-day line on a retest. Until then the current move is a far-travelled recovery that has, for the first time, a technical foundation under it.
What RSI and Moving Averages Mean for a SUI Entry
The 14-day relative strength index stands at 66.9. Anything above 70 counts as overbought in the standard reading; in August the indicator was above that mark, today it is just below. The reading does not say the price has to rise. It says the advance of the past weeks no longer stretches the indicator, even though the price itself is far higher. Anyone buying today buys after 30 days worth 62 percent, not before them.
Both moving averages now sit below the price. The 50-day moving average is at 0.8864 US dollars, with the price 31.9 percent above it. The 200-day moving average at 0.9637 US dollars lies 21.3 percent below the price. What has not turned is the relationship between the two lines: the 50-day average is still 8.0 percent below the 200-day average, because the long line is still digesting last year's slide. Only a crossover from below confirms the trend change at indicator level too.
That constellation is typical of the middle phase of a bottoming process: the short-term signals have turned, the long-term average has been taken, and confirmation by the crossover is outstanding. What the indicator set also shows plainly is that the cheapest entry of the past twelve months lies six weeks in the past and is 79.5 percent more expensive today.
What Trading Volume Reveals About Demand for SUI
Around 1.02 billion US dollars worth of SUI changed hands in 24 hours. Measured against the market capitalisation of 4.79 billion US dollars, that is a turnover rate of roughly 21 percent in a single day. It is a high figure, and it is not an outlier: daily turnover averaged 818 million US dollars over the past 30 days and 420 million over 90 days. The advance therefore ran at about twice the quarter's volume and did not happen in a thin market.
For the buying decision this cuts both ways. On the positive side, anyone building or unwinding a position finds liquidity and does not have to accept large discounts on execution, and a breakout accompanied by rising turnover is sturdier than one on a thin book. On the critical side, high turnover during a far-travelled recovery also means that many participants are using the move to get out. Volume measures participation, not conviction.
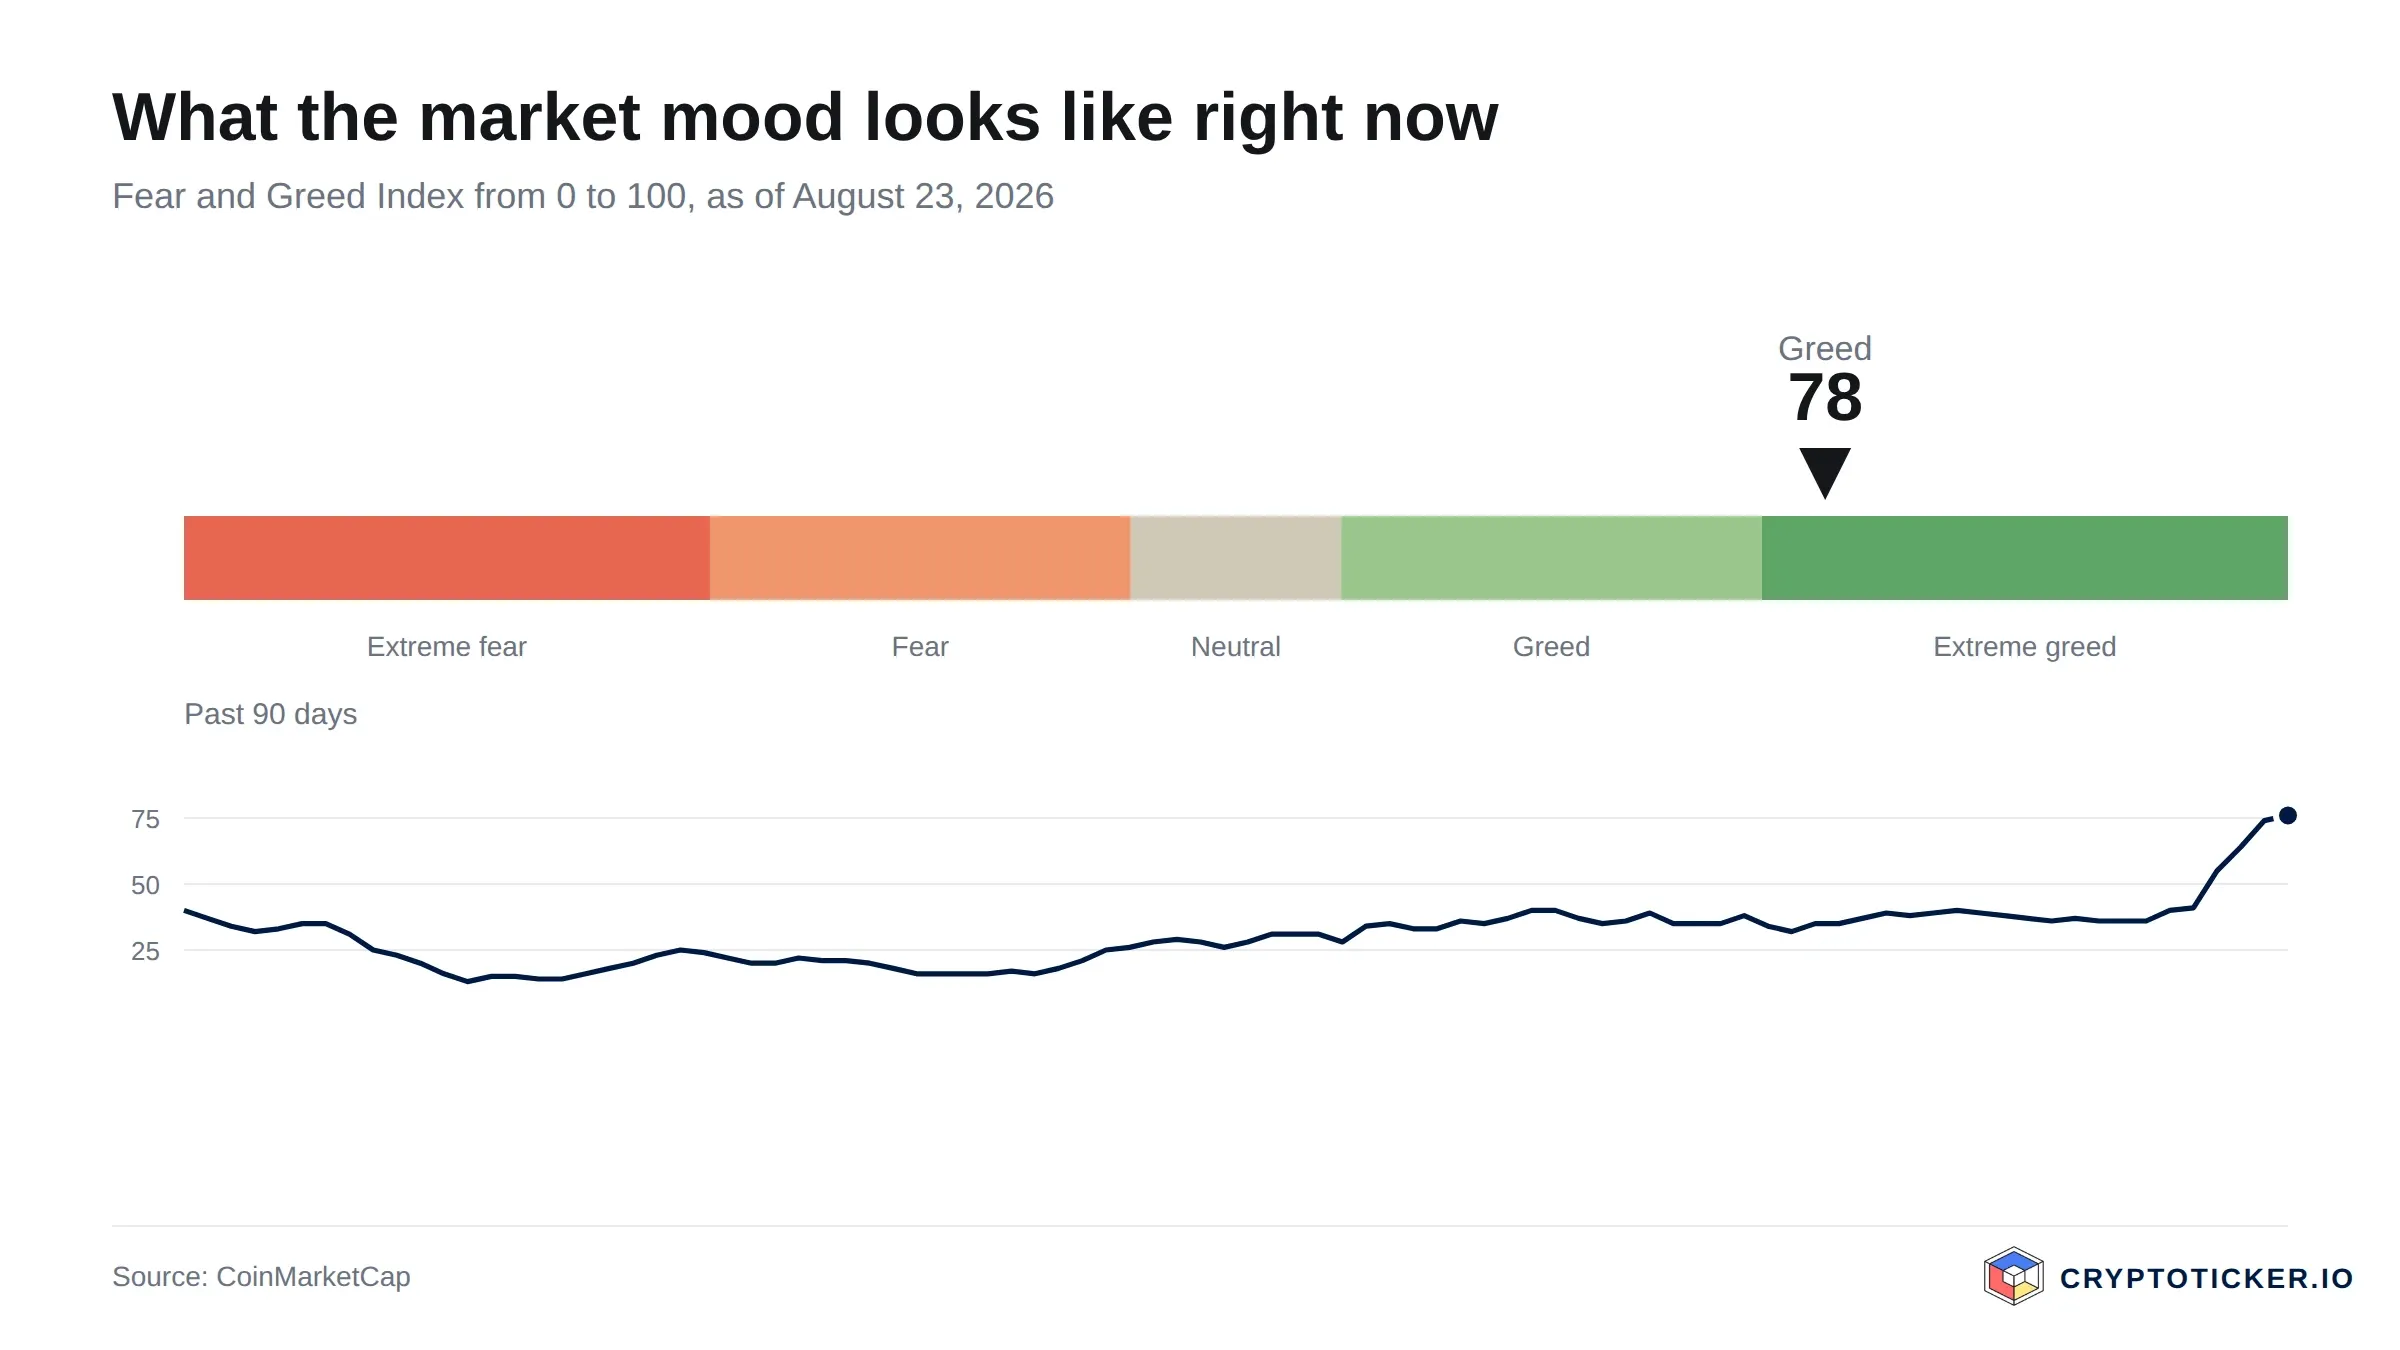
Market sentiment adds context. The Fear and Greed Index stood at 74 points on 1 October 2026, placing it in the greed range. Historically these are not the phases in which buyers get the best prices, and they are the phases in which patience is hardest to maintain.
Which Structural Factors Speak for SUI
Beyond the chart, substance decides. SUI is a layer-1 blockchain built on a data model that treats assets as individual objects rather than as account balances. Technically this allows many transactions to be processed in parallel instead of forcing them into a single sequence. The architecture and the role of the token are described in the official developer documentation.
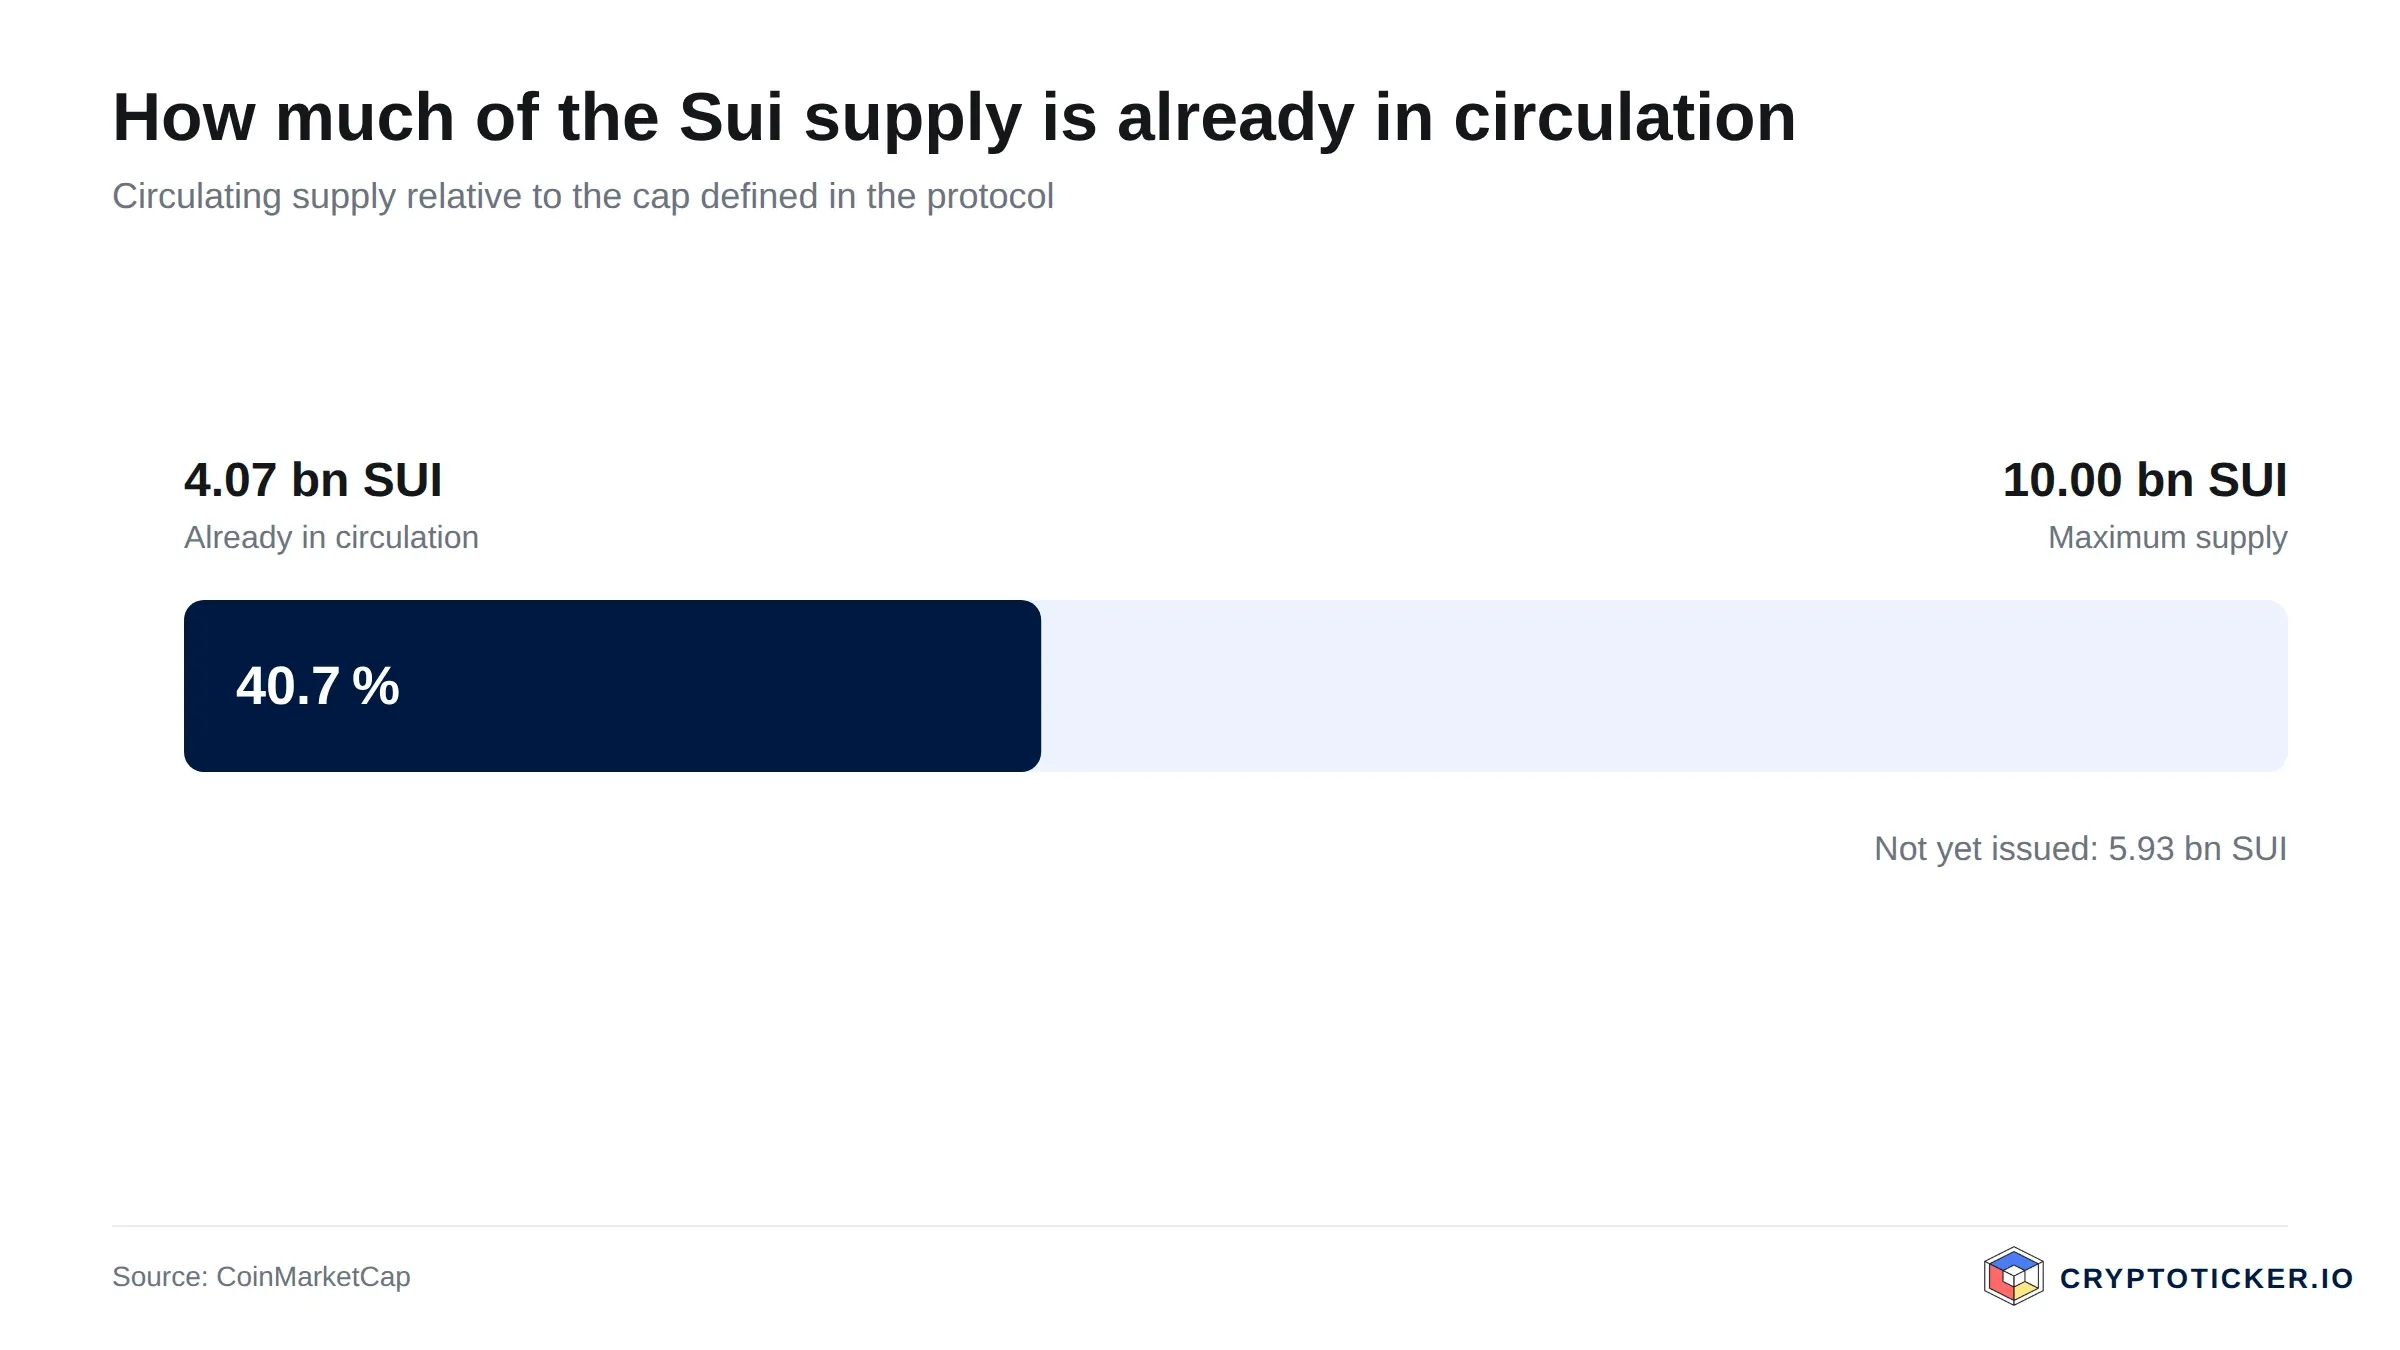
Supply mechanics deserve the closer look. The maximum supply is capped at 10 billion tokens, of which 4.10 billion circulate today. The remaining 59 percent enter the market gradually through release schedules. That dilution is the single most important structural headwind for the price, because new supply has to be absorbed by new demand simply to keep the price flat.
Regulation is the third factor. In the European Union, crypto assets are governed by the MiCA framework, which the European Securities and Markets Authority supervises and specifies through technical standards. For a token like SUI this cuts in a mostly favourable direction: clear rules for trading venues and custody lower the barrier for regulated providers, though they do not make any statement about the price.
What Speaks For Buying SUI at Current Prices
First, the distance to the peak. At 67.8 percent below its twelve-month high of 3.6285 US dollars, SUI is priced far away from the expectations of October 2025. Whoever buys today pays for a project whose most optimistic assumptions have already been removed from the price.
Second, the reclaimed long-term average. The price has taken the 200-day moving average at 0.9637 US dollars, the line it was a fifth below in August. That is the first chart signal in a year that describes something other than a downtrend, and it gives the long-term case a technical leg to stand on.
Third, the liquidity. A turnover of roughly 21 percent of market capitalisation per day and rank 28 in the overall market mean SUI can be traded in both directions without meaningful slippage. That matters more than it sounds: an asset you cannot exit at a fair price during stress is a different asset from the one you bought.
What Speaks Against Buying SUI at Current Prices
First, the timing. After 30 days worth 62.1 percent, the entry falls into the late part of the move. The RSI of 66.9 no longer flags an overbought market, but anyone buying now is paying the price of the recovery rather than the price of the low, and the 79.5 percent between the two is the difference between patience and haste.
Second, the distance to the nearest support. The price is 21.3 percent above the 200-day moving average at 0.9637 US dollars, and the 50-day average at 0.8864 US dollars sits a further 8.0 percent below that line. The reclaim is done, but a pullback to the first reliable level costs roughly a fifth. Buying here means buying well above the zone where the position can be defended.
Third, the dilution. Around 59 percent of the maximum supply is still to be released. Additional tokens reaching the market meet demand that has to grow at least as fast merely to keep the price stable. This is a headwind that has nothing to do with the chart and does not disappear with a good quarter.
How to Buy SUI at Current Prices
Costs come in three layers, and only the first is usually advertised. There is the trading fee, typically between 0.1 and 1.5 percent depending on the venue and the order type; there is the spread between bid and ask, which is invisible on the invoice but real in the fill; and there are withdrawal fees if you move the coins off the exchange. On a small position the spread can easily exceed the stated fee.
Which venue suits you depends less on the headline fee than on how you intend to hold. Our exchange comparison sets the fee structures side by side, and readers who want a European regulatory footing will find the relevant venues in the overview of regulated crypto exchanges. Our detailed Kraken review and the Bitpanda review cover deposit methods, fee models and support in practice.
Custody is the decision most buyers postpone. Coins left on an exchange are convenient and remain the platform's counterparty risk. Coins moved to your own wallet are your responsibility, including the backup of the recovery phrase. For positions you intend to hold for years, dedicated hardware is the standard answer, and our hardware wallet comparison explains what the devices differ on.
So Is SUI a Good Buy at Current Prices?
The two horizons give different answers, and merging them is where most buying decisions go wrong.
Short term, the data argues for patience at 1.1694 US dollars. A 62.1 percent month behind the price, a level 21.3 percent above the long-term average and a sentiment reading of 74 points describe a market that has already moved. The RSI of 66.9 takes the acute overheating out of that picture but does not replace the missing cushion below: the nearest support is the 200-day moving average at 0.9637 US dollars, and beneath it the twelve-month low at 0.6514 US dollars, 44 percent below spot. The risk is therefore still asymmetric in the uncomfortable direction.
Long term, the question is not the chart but the supply schedule against actual usage. If the network's transaction demand grows faster than the roughly 59 percent of supply still to be unlocked, the current price is a discount on that development, and the reclaimed 200-day line is the first technical reading that fits that case. If it does not, the dilution alone is enough to keep the price under pressure even without a bad market.
Two conditions would falsify the constructive case. The assumption that the reclaim holds is refuted if SUI closes back below 0.9637 US dollars for several sessions, because the breakout would then read as an overshoot. The assumption of a completed bottom is refuted if SUI subsequently loses the twelve-month low at 0.6514 US dollars, because the support that gives the position its defined risk would then be gone. Everything between those two lines is noise, and treating it as signal is the expensive habit in this market.
Buying SUI: what to take away
- The trend is damaged, the confirmation is missing. SUI sits 21.3 percent above its 200-day moving average of 0.9637 US dollars and 31.9 percent above its 50-day average of 0.8864 US dollars, but the two lines have not yet crossed each other. The longer view on where this might lead is in our SUI price prediction.
- The entry point is stretched, not cheap. A 62.1 percent month means today's buyer pays for the recovery. If you still want exposure, the venue and its fee model decide a measurable part of your result, and our exchange comparison lays those out.
- Dilution is the structural risk. Roughly 59 percent of the 10 billion maximum supply is still to be released. For positions held through that schedule, custody stops being a detail, and our hardware wallet comparison is the place to start.
Disclosure: Some of the providers mentioned in this article work with us through affiliate programmes. This has no influence on the price analysis or the assessment of the chart situation; the price data comes from a public market data source and can be verified there.
(As of 1 October 2026. This article is not investment advice. Prices, fees and conditions change; check them with the provider before every purchase. Crypto assets are subject to high price volatility, and a total loss is possible.)
Transparency note: This article was produced with the assistance of artificial intelligence and reviewed by our editorial team before publication. All figures and claims were checked against the primary sources linked in the text. The feature image was generated with AI.
Related articles
Which topics should we dive deeper into?
Select what genuinely interests you. Your picks feed directly into our editorial planning.
Crypto news that's actually worth your time.
Weekly. 60 seconds. Carefully curated by our editors: no hype, no promo flood, no spam.

September 23, 2024 8:44 AM
Is it a Good Idea to Buy XRP below $0.60?
With recent XRP price drops positioning it below the $0.60 mark, investors are left pondering. Is it a good idea to buy XRP below $0.60?

September 28, 2026 4:28 AM

Is Quant a Good Buy at the Current Price?
Quant has broken out sharply after a mandate in US payments and stands at its highest level in twelve months. Is QNT a good buy at the current price? We examine the chart situation, volume and supply mechanics with our own data.
August 27, 2026 11:25 AM

Is Pump.fun a Good Buy at Current Prices?
PUMP has cleared both its 200-day and its 50-day average, yet it still trades well below its twelve-month high. We check with our own price data what argues for and against buying Pump.fun at the current price.
August 27, 2026 6:38 AM

Is NEAR Protocol a Good Buy at Current Prices?
NEAR has worked its way back above both of its moving averages while still trading well below its twelve-month high. We check with our own price data what speaks for and against an entry at current prices.
August 27, 2026 4:31 AM

Is AAVE a Good Buy at Current Prices?
AAVE has worked its way back above both the 200-day and the 50-day moving average, yet still trades far below its twelve-month high. Using our own price data, we examine what speaks for and against an entry at current prices.
August 27, 2026 3:24 AM

Is Hedera a Good Buy at Current Prices?
HBAR has bounced off its twelve-month low but still trades well below its long-term average. We weigh moving averages, RSI and volume to judge whether Hedera is a good buy at the current price.
August 16, 2026 12:21 PM

Is Toncoin a Good Buy at Current Prices?
Toncoin has reclaimed both of its moving averages and now goes by the name Gram. We weigh what the chart, the RSI and the recovery in trading volume say for and against buying at current prices.
May 18, 2026 1:07 PM
Is Solana a Good Buy in 2026? SOL Price Analysis and Potential ROI
Solana (SOL) trades at $119.48 after clearing the $100 resistance. Here's how SOL's potential returns stack up against BTC, ETH, and XRP.
August 23, 2026 1:16 AM

Is PEPE a Good Buy at the Current Price?
PEPE is back above both moving averages and the 50-day has crossed the 200-day. Is the memecoin a good buy at the current price, or is the rally already running on thin volume?
August 24, 2026 12:50 AM
Is Bitcoin Cash a Good Buy at Current Prices?
Bitcoin Cash has rallied hard off its June floor, but it still trades below its long-term trend line with the RSI stretched. We work through what speaks for and against buying BCH at current prices.
August 24, 2026 12:34 AM
Is Monero a Good Buy at Current Prices?
Monero holds above both of its long-term averages after a strong summer, yet still trades far below its twelve-month high. We look at what the trend, the turnover and the regulatory picture mean for anyone weighing a purchase of XMR now.
August 24, 2026 12:19 AM
Is Zcash a Good Buy at Current Prices?
Zcash has run far ahead of its own long-term averages after a week that changed the chart. We look at what the trend, the RSI and the turnover actually support, and under which conditions the case for buying ZEC breaks down.
August 23, 2026 2:21 PM

Is Hyperliquid a Good Buy at Current Prices?
HYPE set its twelve-month high in September and has given part of it back, with the RSI now neutral. We weigh chart, RSI, trading volume and supply mechanics to see what argues for and against buying Hyperliquid at current prices.
August 3, 2026 10:41 AM
Is XRP Coin a Good Buy At Current Prices?
XRP trades at $1.4797 and is holding above the 200-day EMA. Why that line at $1.3894 now decides, as support, whether the reversal holds.

July 17, 2026 7:55 PM
Is XRP a Good Investment in 2026? Price Analysis and Prediction
XRP has broken out of its summer range and is holding above its 200-day average — without the catalyst the market waited a year for. What the chart, the CLARITY Act and 2026 forecasts really say.
February 19, 2025 1:00 PM

Dogecoin Price Prediction: Here's Why DOGE Price is a Good Buy Today
Dogecoin is gaining traction as ETF speculation grows. Could this be the next big move for DOGE investors? Is Dogecoin a good buy at today's price?
February 8, 2025 10:00 PM
Top 3 Reasons Why Ethereum Price Is a Good Buy Today
Despite recent price drops and rising competition, Ethereum shows strong signs of a potential rebound. Discover the key factors making ETH a smart buy right now.
March 31, 2026 9:45 AM
Cardano (ADA) Down 60%: Is Cardano Dead or Set for a Comeback in 2026?
Cardano (ADA) is down over 60% yearly. Is ADA dead, or preparing for a rebound? Key levels, Iran war impact, and price targets ahead.
December 10, 2024 12:30 AM

Bitcoin Price Drops Below $100K – Is a Bigger Crash Coming?
Bitcoin has fallen below $100K, triggering a broader market correction of over 8% in the last 24 hours. With profit-taking and large sell-offs hitting the market, could Bitcoin drop to $90K or lower?
July 27, 2024 2:34 PM

Why Is The Crypto Market Up TODAY?
With the Bitcoin 2024 Conference taking place now in Nashville, the crypto market is showing bullish signals, intriguing traders around the future of Bitcoin and Altcoins.
September 29, 2024 7:11 PM

What If SUI Price Surges Past $2 Resistance?
SUI price surge is on the verge of breaking the $2 resistance after a strong rally, with a bullish pattern suggesting...
April 24, 2026 3:29 PM
XRP Price Prediction: Why Ripple is Stuck in a Sideways Grind
XRP price remains stagnant despite regulatory wins. This XRP price prediction analyzes the technical chart and identifies the key breakout levels for 2026.
July 22, 2025 9:28 AM
XRP Price Prediction: Is Now the Right Time to Buy XRP After the Dip?
XRP price pulled back -2.6% in the last 24 hours following a sharp +22% weekly surge. Should you buy the dip or wait for a better entry?
September 21, 2026 4:15 PM

Sui Jumps 26 Percent: The Strongest Coin In The Top 30
Sui gains around 26 percent within 24 hours and beats every other asset in the top 30. Behind the move sit a prominent bet on the AI economy, a new bitcoin protocol and a rotation into layer 1 chains.
June 15, 2026 11:45 AM

Zcash Price Prediction: ZEC Surges 15% as Privacy Coins Lead the Crypto Rebound
Zcash price prediction as ZEC surges 15% in 24 hours, outperforming Bitcoin, Ethereum, Solana, and XRP. Can the privacy coin rally continue?
July 7, 2024 3:21 PM
XRP, DOGE, and ADA Price Prediction: A Fast Recovery BUT How Long Lasting?
The potential turnaround for XRP, Dogecoin, and Cardano as key metrics indicates a buying opportunity amidst the current market downturn. Here is the latest XRP, DOGE, and ADA price prediction and analysis for a better understanding.

More from CryptoTicker