
Is Toncoin a Good Buy at Current Prices?
Toncoin has reclaimed both of its moving averages and now goes by the name Gram. We weigh what the chart, the RSI and the recovery in trading volume say for and against buying at current prices.





Which topics should we dive deeper into?
Select what genuinely interests you. Your picks feed directly into our editorial planning.
Crypto news that's actually worth your time.
Weekly. 60 seconds. Carefully curated by our editors: no hype, no promo flood, no spam.
Toncoin changes hands at 1.5979 USD, roughly 44.1 percent below the twelve-month high of 2.8593 USD reached on 4 October 2025. The discount has narrowed sharply over the past month, which changes the question rather than settling it: is Toncoin a good buy at current prices, or has the easy part of the recovery already happened?
One point needs clearing up first. The listing formerly known as Toncoin now trades as Gram, ticker GRAM, and the project's own site at ton.org uses the new name throughout. It is the same listing under a new label rather than a fork or a token swap. We keep the familiar name here because that is what readers search for.
cryptoticker.io collected the price data for this analysis on 27 September 2026. Market data comes from CoinGecko, and every indicator quoted here was calculated in house from 365 daily closing prices using standard formulas: exponential moving averages for the trend, Wilder's method for the relative strength index.
Toncoin price analysis: where the TON price stands and which levels matter
At 1.5979 USD the Toncoin price sits above both reference lines that medium-term investors watch. The 50-day exponential moving average stands at 1.3889 USD, which puts the current price 15.0 percent above it. The 200-day exponential moving average, the slower of the two, sits at 1.5479 USD, and the price has moved 3.2 percent clear of it. In chart terms, Toncoin has climbed out of the lower third of its own annual range and now trades near the middle of it.
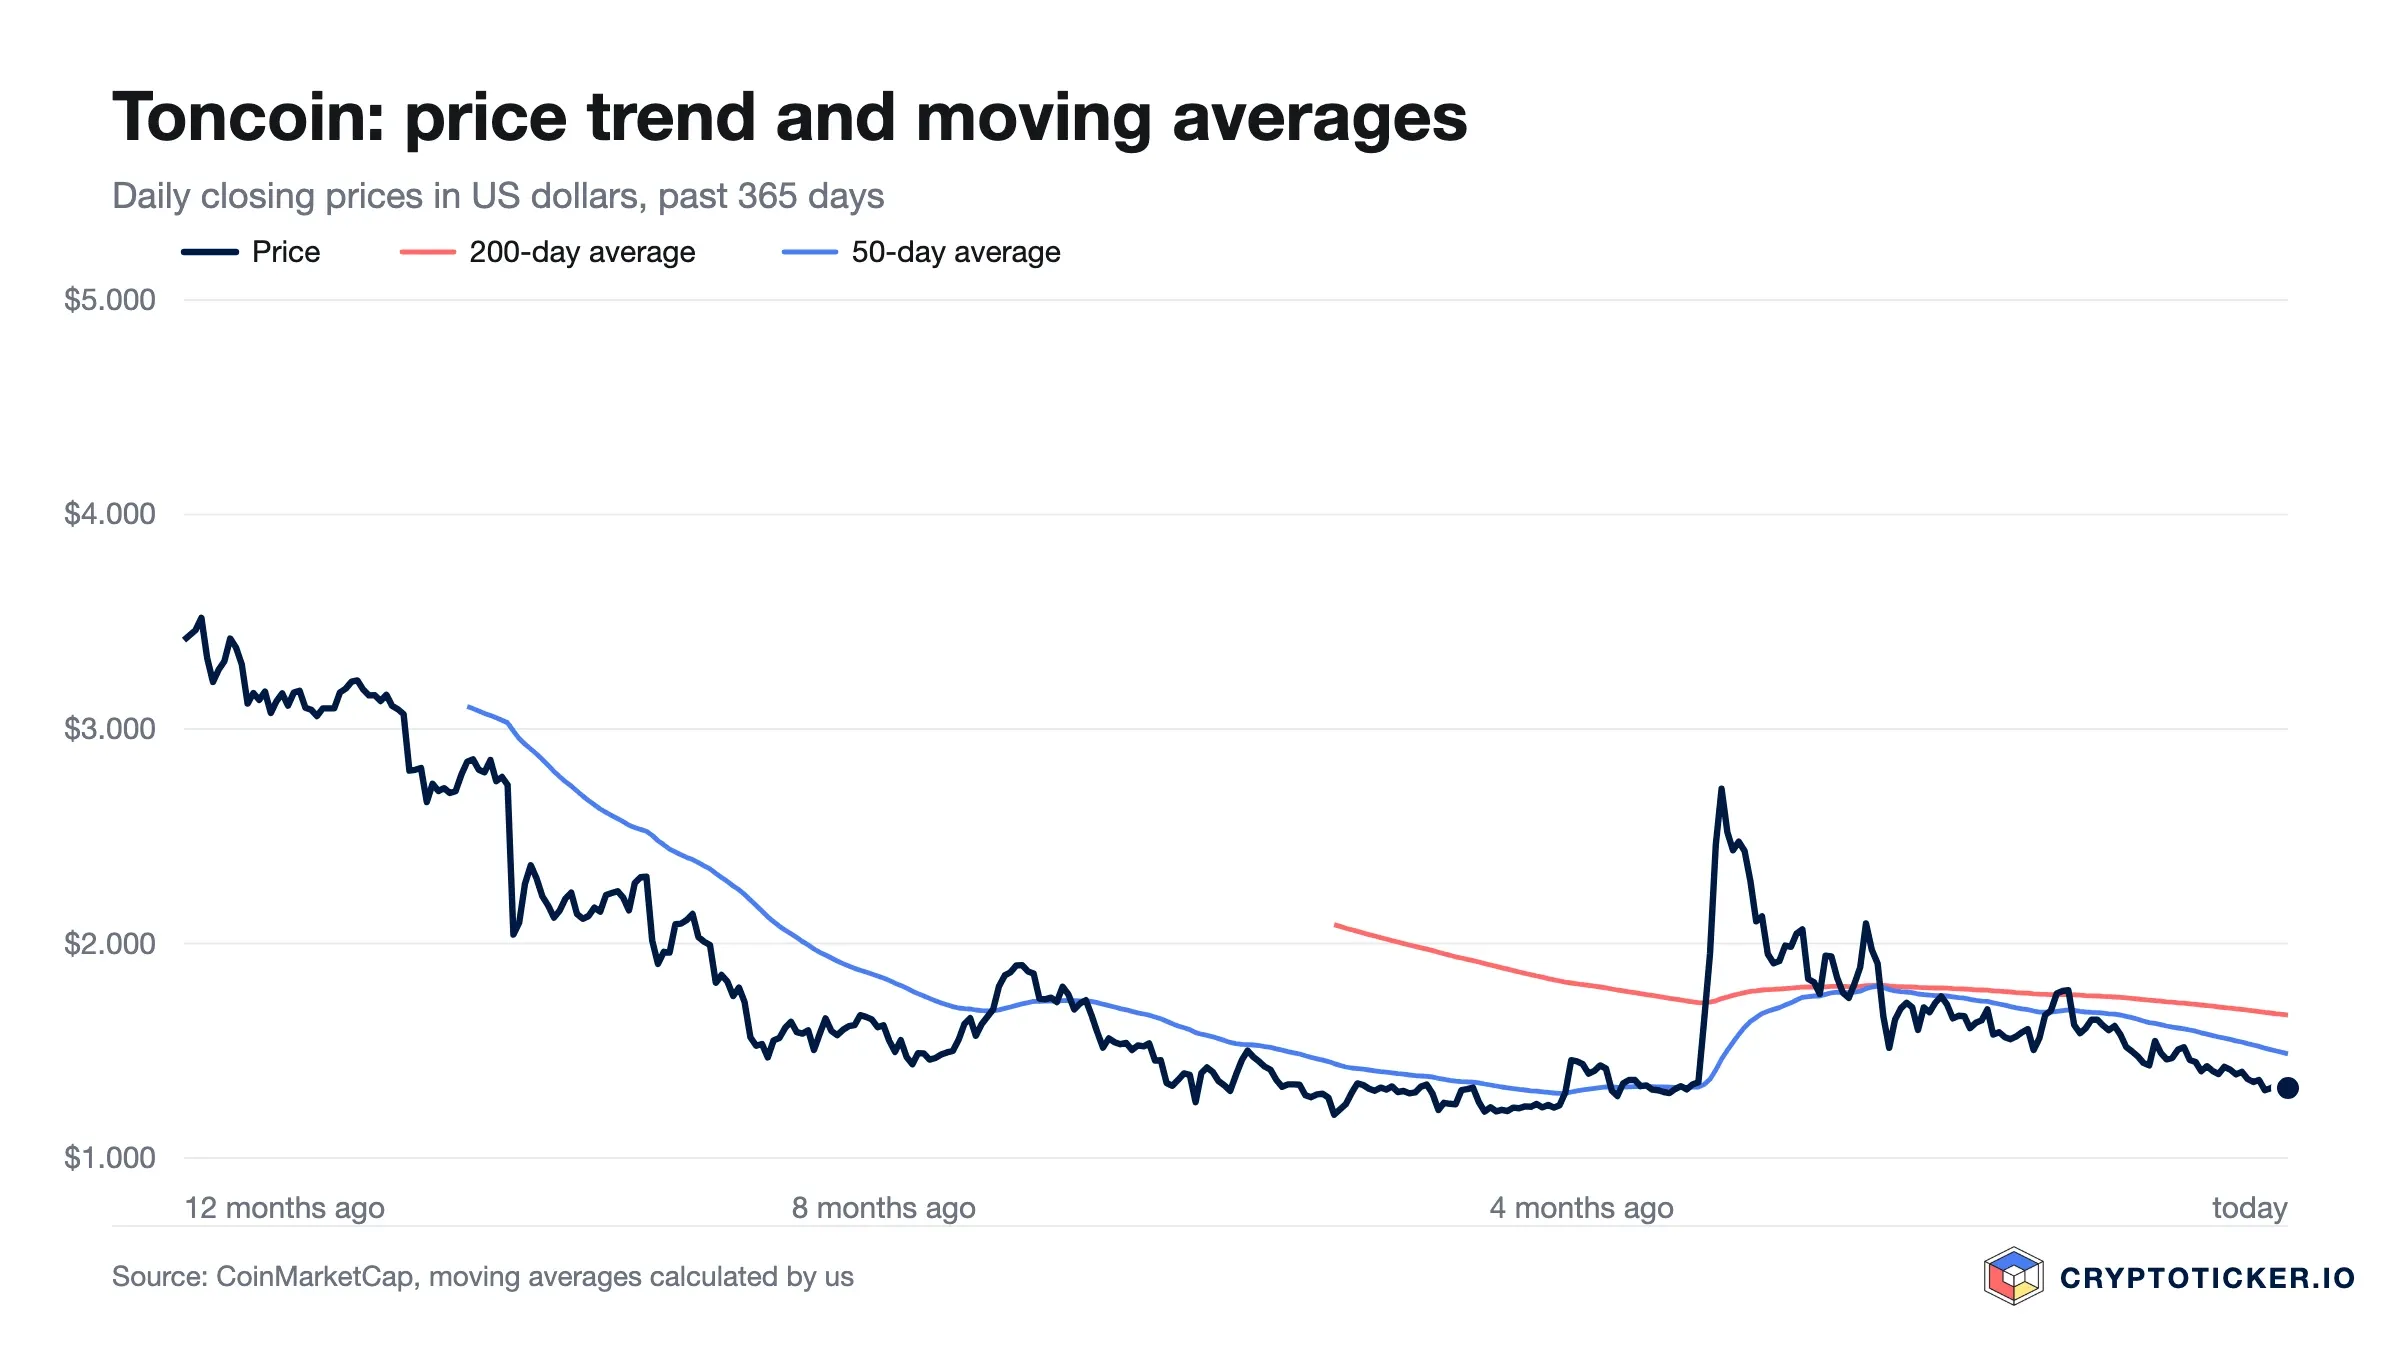
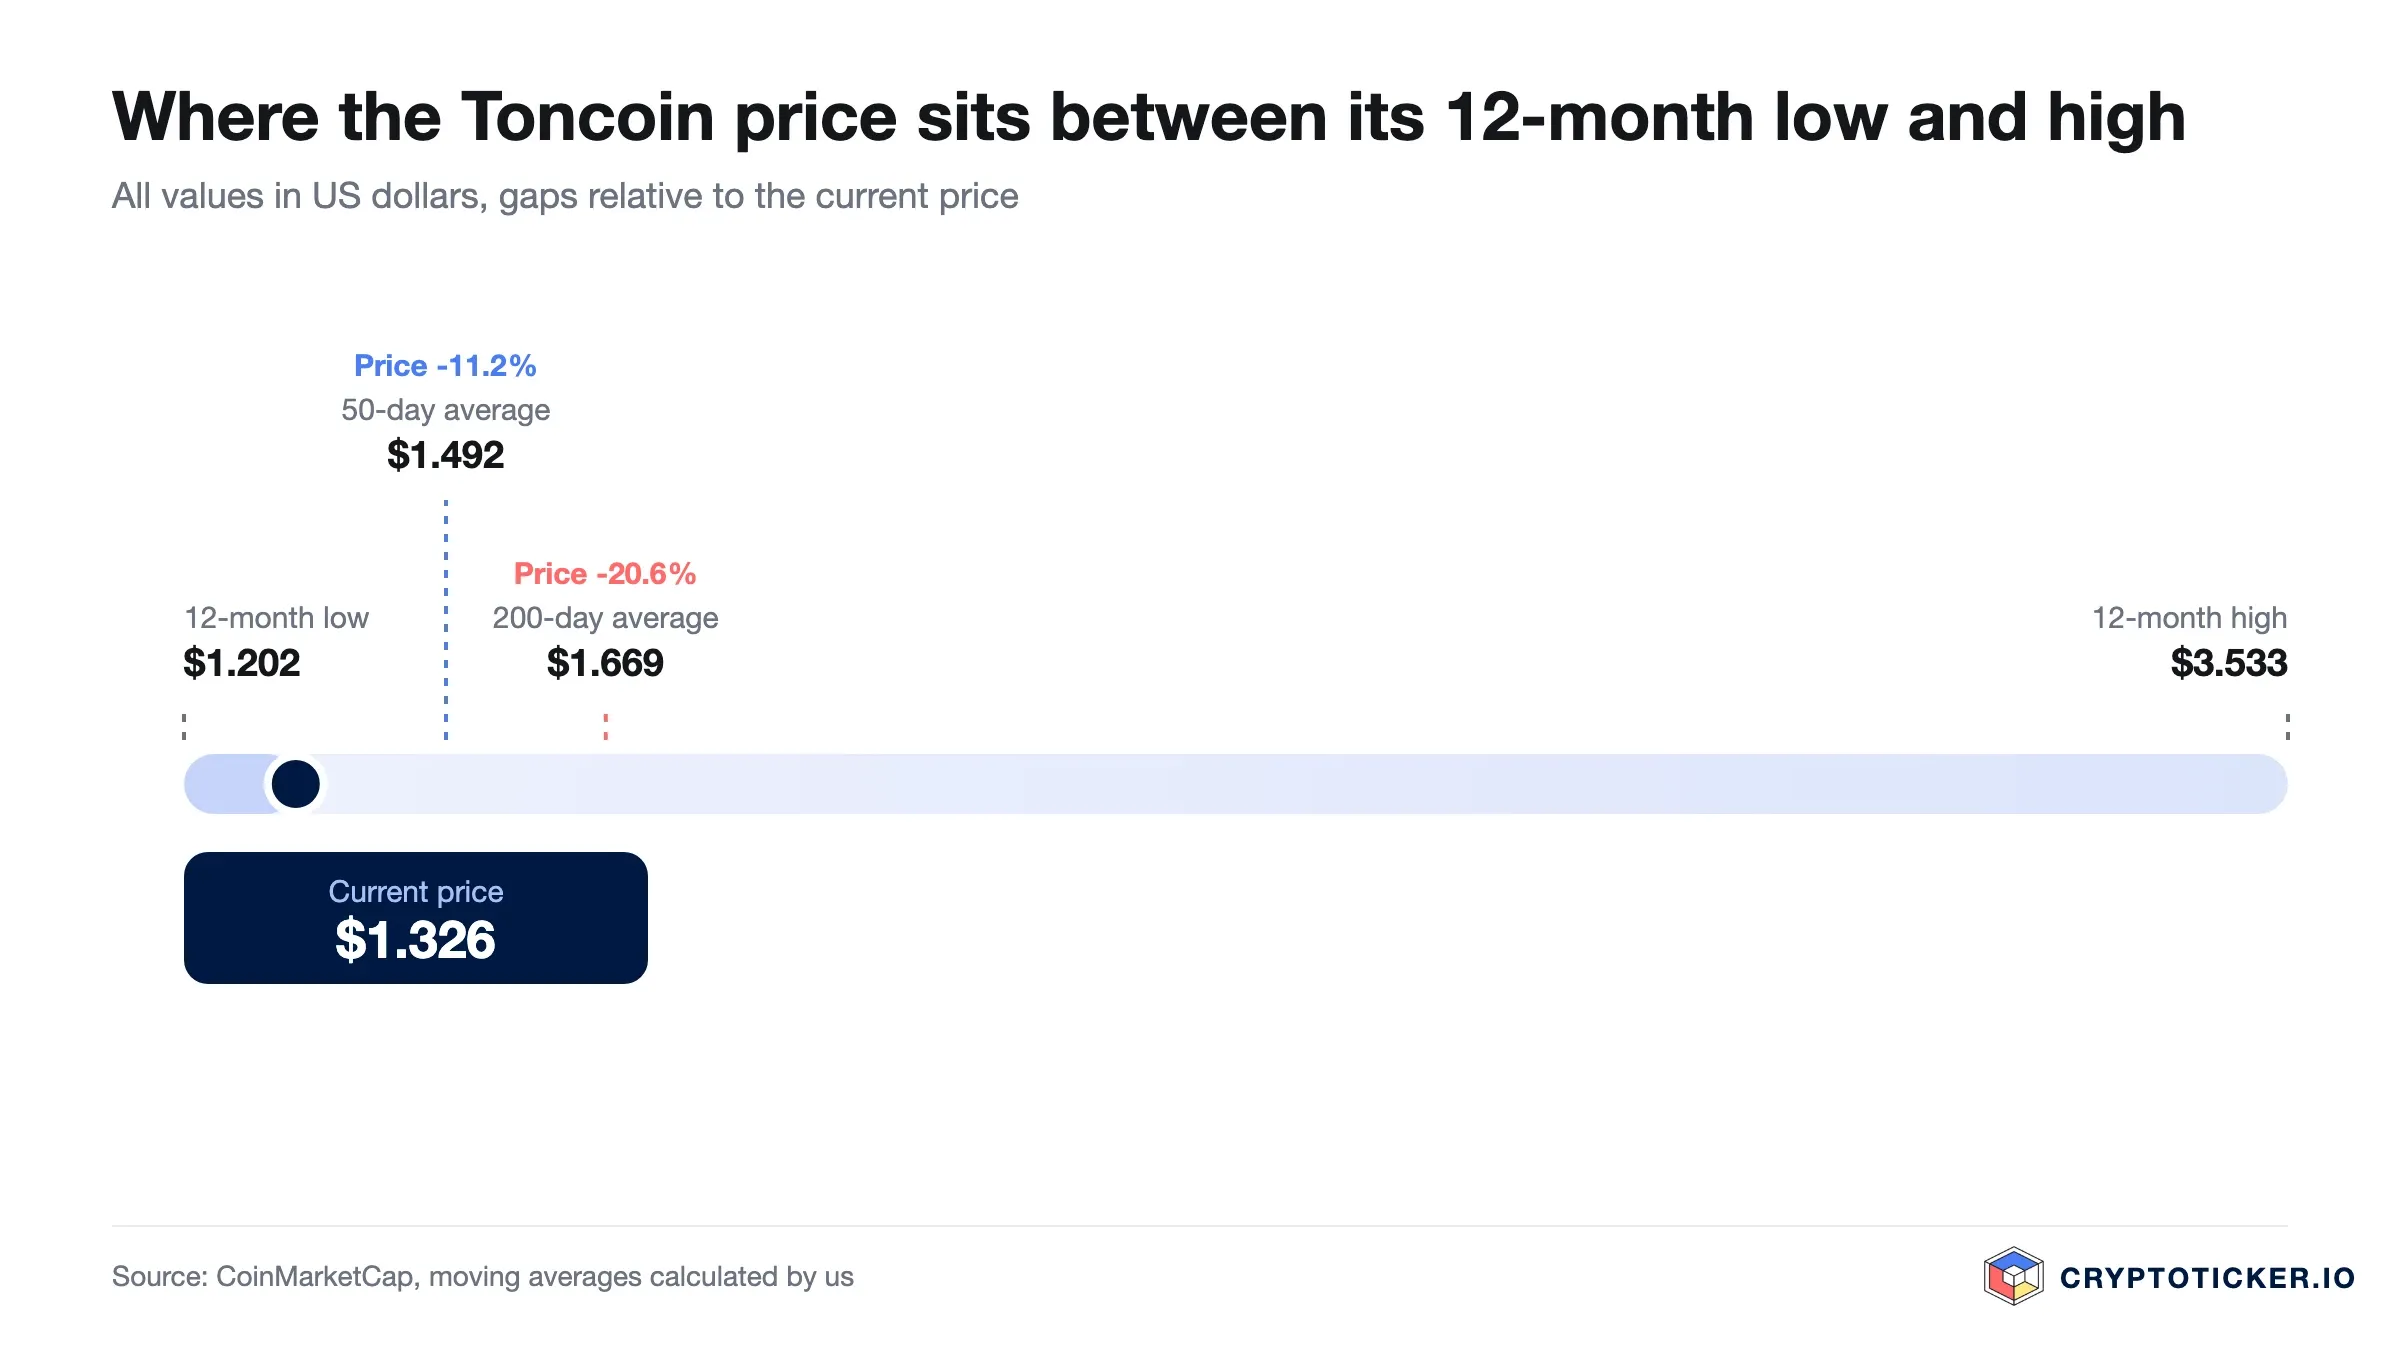
The floor of that range is well defined. The twelve-month low of 1.2174 USD dates from 28 March 2026, and the current price now sits 31.3 percent above it, a far wider cushion than through the summer. The ceiling remains distant: the 2.8593 USD high from October 2025 would require a further gain of about 79 percent.
Three levels therefore frame any decision at current prices. The March low near 1.22 USD is the zone buyers defended once before. The 50-day line at 1.3889 USD has turned from an obstacle into the first line of support beneath the price. The 200-day line at 1.5479 USD is the level the breakout now has to hold to separate a bounce from a trend change.
Is the Toncoin downtrend broken or only interrupted?
The data now says broken at the short end and unconfirmed at the long end. Over 30 days Toncoin is up 16.7 percent, over 90 days it is essentially flat at minus 0.1 percent, and over twelve months it is still down 41.3 percent. The windows no longer point the same way, which is what the beginning of a turn looks like.
What has changed is the direction. The March low at 1.2174 USD has held for six months; the lowest print since then was 1.2187 USD. From the August trough near 1.33 USD the price has added close to 20 percent, and it has done so while reclaiming both moving averages. A base of that kind is a precondition for a trend change, and this time the price has acted on it.
What is still missing is confirmation from the averages themselves: the 50-day line at 1.3889 USD remains below the 200-day line at 1.5479 USD, so the two have not yet crossed. Until they do, the defensible description is a recovery inside a downtrend that has not been formally reversed, and anyone buying at current prices is assuming the crossover follows.
What RSI and moving averages mean for a Toncoin entry
The relative strength index over 14 days reads 68.6, well above the neutral midpoint of 50 and just below the 70 mark conventionally treated as overbought. The practical meaning has inverted since August: momentum is now firmly with the buyers, and the cheap entry the indicator pointed to in the summer no longer exists.
The two moving averages add the structural picture. With the price at 1.5979 USD above the 50-day line at 1.3889 USD and above the 200-day line at 1.5479 USD, the price side of the alignment has turned constructive. The averages themselves have not: the 50-day line still sits under the 200-day line, which is what an unfinished recovery looks like from the inside.
For an entry decision, the combination argues for caution about timing rather than about direction. It rules out the argument that Toncoin is technically cheap, and it raises the odds of a pullback after a 16.7 percent month. Investors who need a technical trigger have already had it at 1.5479 USD, which is a reason to stagger purchases rather than to chase a single price.
What Toncoin trading volume reveals about demand
Volume deserves the most attention here, and it is where the picture has changed most. Toncoin turned over 143.7 million USD in the last 24 hours. The 30-day average sits at 45.7 million USD, the 90-day average at 36.1 million USD, and the full-year average at 94.0 million USD. Activity is running at roughly one and a half times the annual norm and about three times the 30-day average.
Returning volume has two consequences for a buyer. A rise carried by turnover is more durable than one on thin trade, which is precisely what the summer rally attempts lacked against a market capitalisation of 4.48 billion USD. The other side is that volume spikes of this size also cluster at the end of short moves, so the surge confirms participation without guaranteeing continuation.
Market capitalisation places Toncoin at rank 30 among crypto assets, a large-cap position by any measure, though four places lower than in August. The tension in this asset has eased rather than disappeared: the valuation is now supported by turnover above its own yearly average. The broader market is supportive too, with the Fear and Greed Index at 70, in greed territory, which is itself a reason not to buy in one go.
Structural factors that speak for Toncoin: supply, usage and regulation
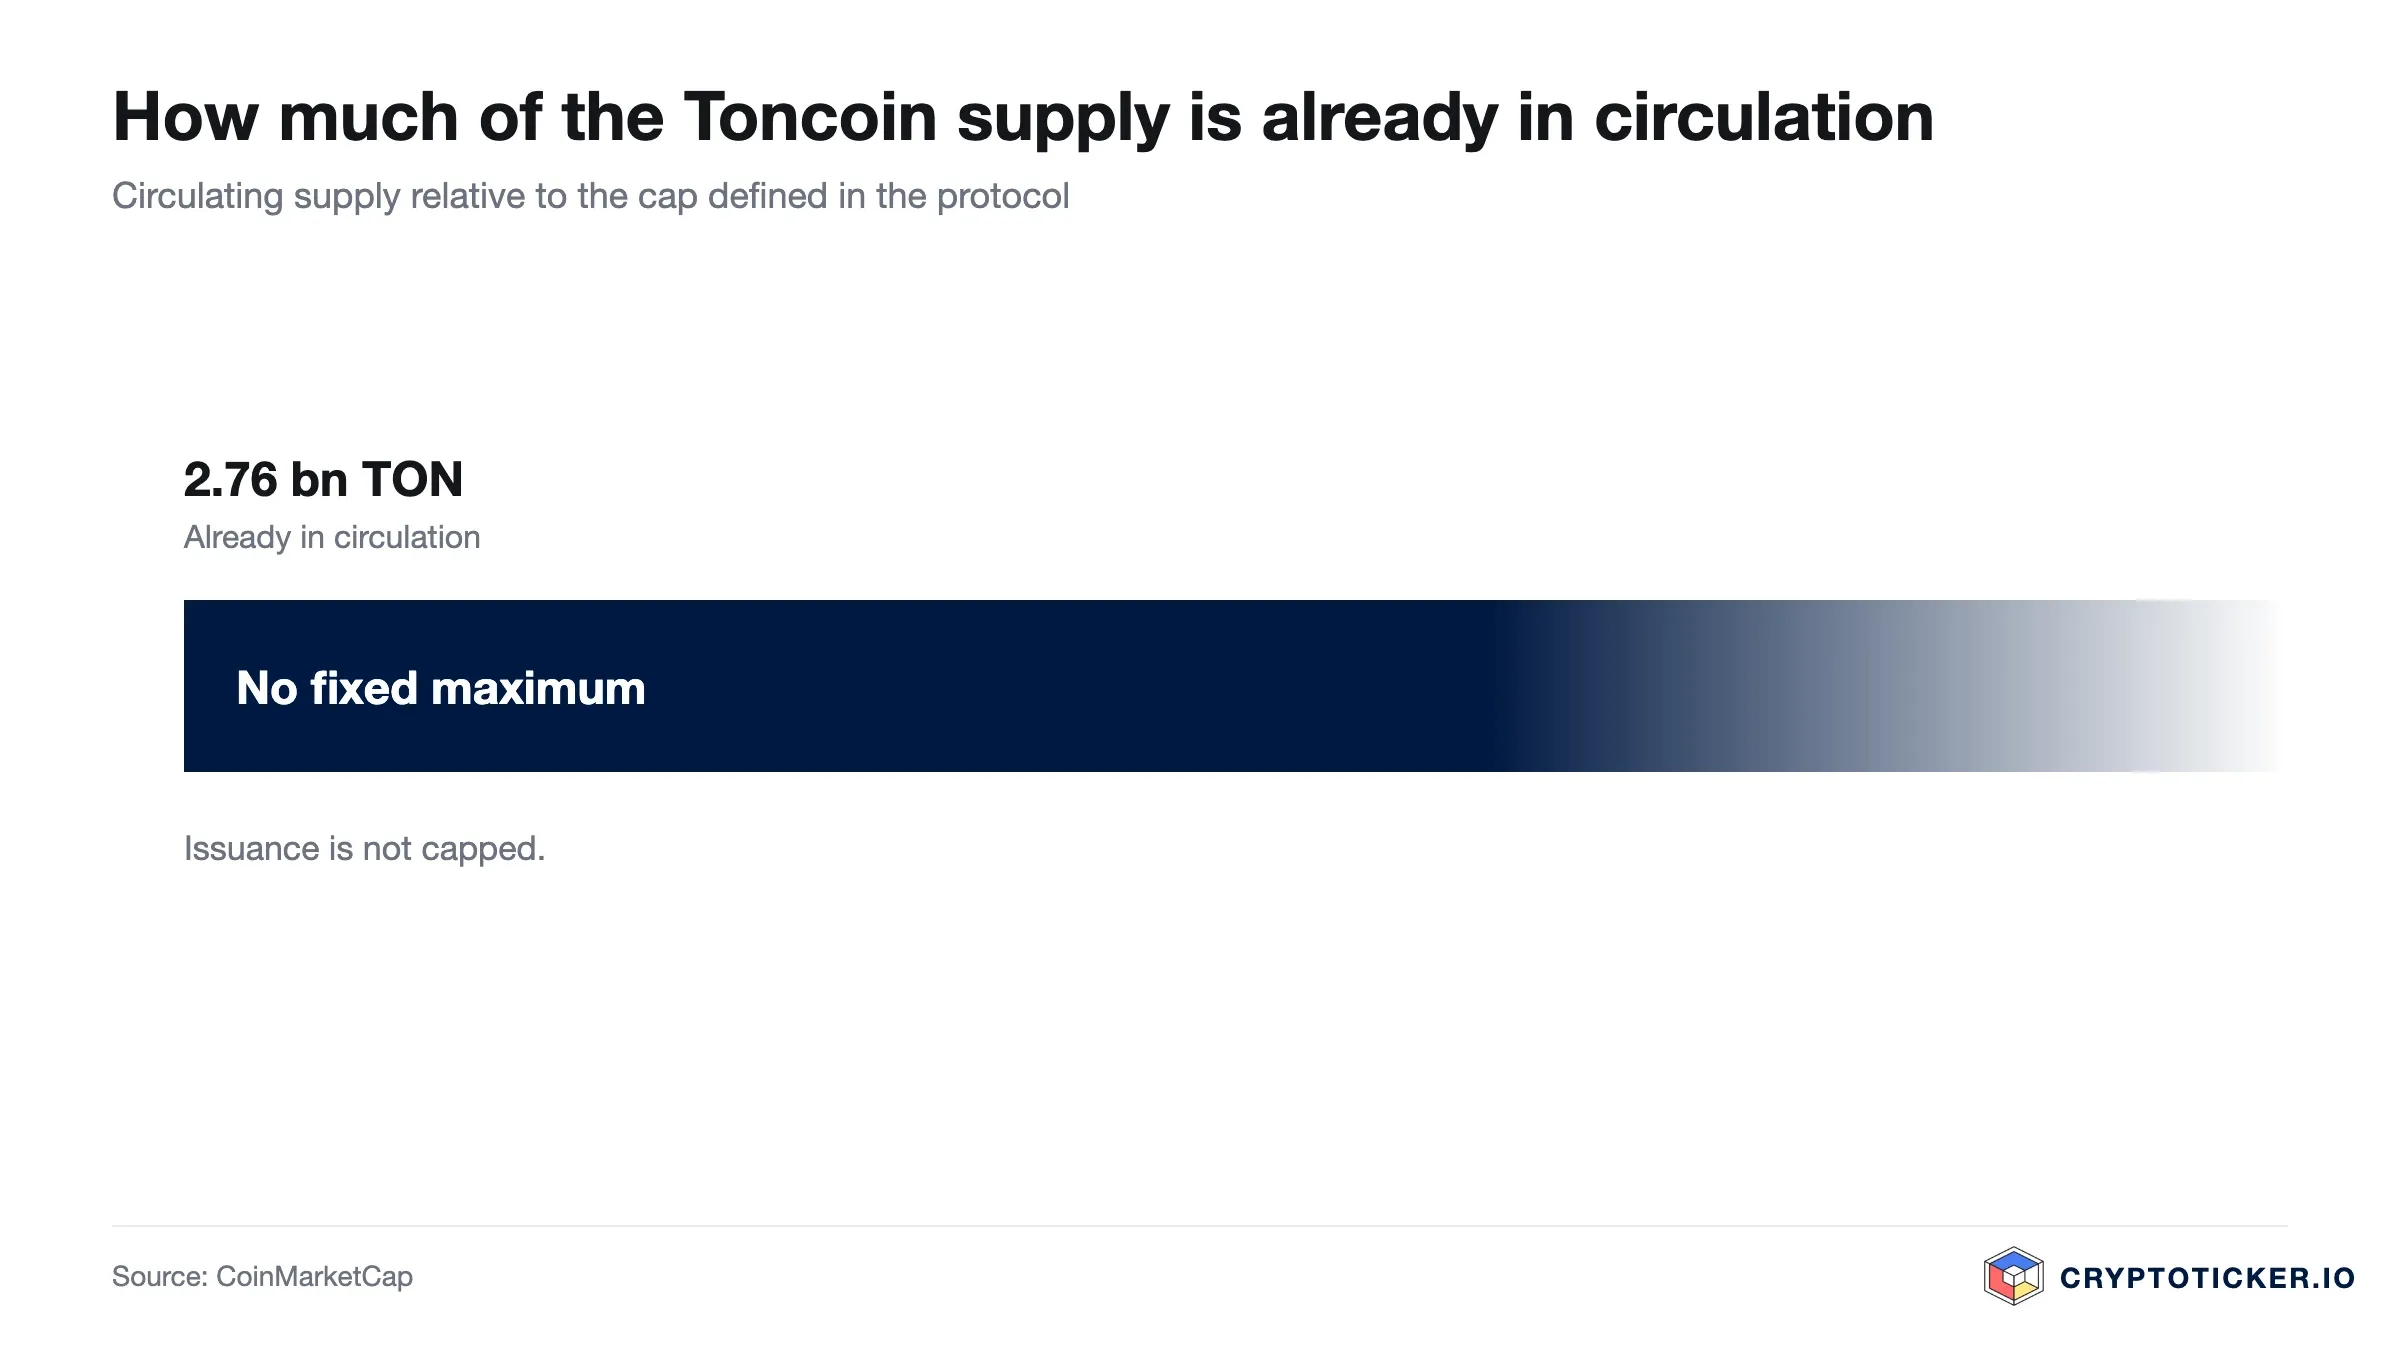
Supply mechanics come first. Roughly 2.814 billion coins circulate out of a total supply of about 5.256 billion, with no hard maximum in the sense that Bitcoin has one. Inflation is bounded by protocol rules rather than a fixed cap, so the circulating share can keep rising. A buyer at 1.5979 USD is buying a claim on a supply base that is not fixed, and that belongs in any valuation.
Usage is the more distinctive argument. The network's design and its documentation at docs.ton.org centre on cheap, high-throughput transfers aimed at consumer payments inside a messenger environment rather than on complex financial contracts. That distribution channel is the asset's genuine differentiator among large-cap chains, and it is why the listing survived a drawdown of more than 60 percent without losing its large-cap standing.
Regulation is the third factor, and the picture is neutral to mildly favourable. Under the European framework supervised by ESMA, crypto assets face harmonised disclosure and custody requirements across the bloc, which has made large-cap tokens easier for regulated venues to list and keep listed. That lifts no single price, but it lowers the risk that a large-cap coin becomes inaccessible on European platforms.
Against those points, the rename to Gram carries a practical cost that is easy to underestimate: ticker changes fragment search traffic, complicate portfolio tracking and occasionally delay listings on smaller venues. We regard this as transitional friction rather than a structural flaw, and flag it as interpretation rather than measurement.
What speaks for buying Toncoin at current prices
Three arguments carry weight at 1.5979 USD.
The trend has turned with the price. At 1.5979 USD the price stands above both moving averages for the first time in months, 15.0 percent clear of the 50-day line and 3.2 percent clear of the 200-day line. A buyer here is no longer positioned against every trend signal on the chart, which was the central objection through the summer.
The valuation has already absorbed a severe repricing. A decline of 41.3 percent over twelve months has removed most of the optimism priced in at 2.8593 USD, and the base built at 1.2174 USD has held for six months. Whatever expectations remain at 1.5979 USD are moderate, and assets that have completed their repricing need less good news to move.
The distribution advantage is intact, and volume has returned. The messenger-linked reach that made the network interesting remains in place, a rank-30 market capitalisation of 4.48 billion USD indicates that large holders have not abandoned the listing, and turnover of 143.7 million USD shows attention coming back. Where analysts expect the price to go from here is set out in our Toncoin price prediction.
What speaks against buying Toncoin at current prices
Three counterarguments deserve equal weight.
The turn is not yet confirmed. The price at 1.5979 USD is above the 50-day line at 1.3889 USD and the 200-day line at 1.5479 USD, but the 50-day line still sits below the 200-day line. A price only 3.2 percent above its annual mean falls back below it easily, and until the averages cross, the breakout remains a move inside a downtrend rather than the end of one.
The cheap entry has gone. A 16.7 percent gain in 30 days and an RSI of 68.6 mean buyers now pay up for a move that has already happened, and pullbacks after advances of that size are the rule rather than the exception. Anyone who wanted the August price of about 1.33 USD cannot have it, and that is the most concrete cost in the current setup.
The supply side keeps expanding. With about 2.814 billion of a roughly 5.256 billion total supply in circulation and no fixed cap, new coins keep reaching the market. Demand has recovered above its yearly norm, but it has to stay there: if turnover falls back to the summer level, the structural weight of new supply returns and technical support levels cannot offset it.
How to buy Toncoin at current prices: costs, custody and providers
The cost of buying still matters, even though turnover has recovered, because spreads widen again as soon as activity fades. Spreads on thinly traded pairs can exceed the visible trading fee by a wide margin, so the headline commission is only part of the bill. Our crypto exchange comparison sets out the fee models side by side.
For European investors, regulatory status is the second filter. Supervised platforms offer clearer complaint routes and stricter custody rules, the relevant distinction once positions grow beyond pocket money. The candidates are collected in our overview of the best regulated crypto exchanges, and among individual venues we have examined Bitpanda in detail and Kraken's fee structure and features separately.
Custody is the third decision and independent of the first two. Coins left on an exchange remain in someone else's control, which is convenient for trading and unhelpful for holding. Investors planning to hold across a full cycle generally move to self-custody, and the trade-offs between the leading devices are laid out in our hardware wallet comparison. Toncoin support varies by device, so check before buying rather than after.
So is Toncoin a good buy at current prices?
The data supports different answers over different horizons, and separating them is the only honest way to close.
Short term, the setup has turned constructive without becoming comfortable. Both moving averages now sit below the price and volume at 143.7 million USD gives the move a real foundation, but an RSI of 68.6 after a 16.7 percent month argues against buying in a single tranche. The level to watch is the 200-day line at 1.5479 USD: if the price loses it again, the breakout has failed.
Long term, the case rests on one question: does the messenger-linked distribution advantage translate into sustained usage, or does it remain a promise? Turnover has already recovered past the 94.0 million USD annual average, so the first part of that test is being passed. If usage follows, the price still sits 44.1 percent below its twelve-month high. If turnover falls back while supply expands, a rank-30 market capitalisation of 4.48 billion USD becomes hard to defend, and the drawdown from 2.8593 USD reads as a repricing rather than an overreaction.
The condition that would refute the constructive scenario is specific enough to monitor: a sustained close back below the 200-day line at 1.5479 USD, or a slide in volume toward the 45.7 million USD of the past month. The condition that would confirm it is equally specific: the 50-day line crossing above the 200-day line while turnover holds above its annual norm. The first half of the confirmation is in place, the second is not, which is why the answer at 1.5979 USD is a matter of position sizing rather than conviction.
Buying Toncoin: what to take away
- The price has moved to the middle of its own range, and the range is what defines the risk. At 1.5979 USD, Toncoin trades 31.3 percent above the twelve-month low of 1.2174 USD and 44.1 percent below the 2.8593 USD high, with both moving averages now beneath it. Where analysts see the price heading from this zone is covered in our Toncoin price prediction.
- Volume is now carrying the move, and that can reverse. Turnover of 143.7 million USD against a 94.0 million USD annual average has narrowed spreads for the moment; if it falls back toward the 45.7 million USD monthly average, exits get expensive again, which makes the choice of venue a financial decision rather than an administrative one. The fee models are compared in our crypto exchange comparison.
- Custody is a separate decision from the purchase. Anyone planning to hold beyond a trade should settle the storage question before buying rather than afterwards, and the options are set out in our hardware wallet comparison.
Disclosure: Some of the providers mentioned in this article work with us through partner programmes. This has no influence on the price analysis or on our assessment of the chart situation; the price data comes from a public market data source and can be verified there.
(As of 27 September 2026. This article is not investment advice. Prices, fees and terms change; check them with the provider before every purchase. Crypto assets are subject to high price volatility, and a total loss is possible.)
Transparency note: This article was produced with the assistance of artificial intelligence and reviewed by our editorial team before publication. All figures and claims were checked against the primary sources linked in the text. The feature image was generated with AI.
Related articles
Which topics should we dive deeper into?
Select what genuinely interests you. Your picks feed directly into our editorial planning.
Crypto news that's actually worth your time.
Weekly. 60 seconds. Carefully curated by our editors: no hype, no promo flood, no spam.

May 13, 2026 11:02 AM

Is PEPE Coin worth Buying in 2026?
PEPE has reclaimed both its 50 day and its 200 day average, with trading volume back at its yearly norm. What that means for anyone buying at current prices, and the two levels that settle it.
June 28, 2024 5:22 PM

TON Coin Price Prediction: A New SURGE or DIP Ahead?
Toncoin's on-chain data shows significant activity from large investors, hinting at a potential price rally. But how high can TON go, and at what level will it fall back?
September 28, 2026 9:47 AM
XRP Price Drops Below $1.50: Where Is Ripple Heading This Week?
XRP price slips under $1.50 after a red weekend. Here is the XRP price analysis with the higher and lower targets that matter this week.

August 23, 2026 1:16 AM

Is PEPE a Good Buy at the Current Price?
PEPE is back above both moving averages and the 50-day has crossed the 200-day. Is the memecoin a good buy at the current price, or is the rally already running on thin volume?
August 24, 2026 12:50 AM
Is Bitcoin Cash a Good Buy at Current Prices?
Bitcoin Cash has rallied hard off its June floor, but it still trades below its long-term trend line with the RSI stretched. We work through what speaks for and against buying BCH at current prices.
August 24, 2026 12:34 AM
Is Monero a Good Buy at Current Prices?
Monero holds above both of its long-term averages after a strong summer, yet still trades far below its twelve-month high. We look at what the trend, the turnover and the regulatory picture mean for anyone weighing a purchase of XMR now.
August 24, 2026 12:19 AM
Is Zcash a Good Buy at Current Prices?
Zcash has run far ahead of its own long-term averages after a week that changed the chart. We look at what the trend, the RSI and the turnover actually support, and under which conditions the case for buying ZEC breaks down.
August 11, 2026 5:35 PM

Is Ethereum a Good Buy at Current Prices?
Ethereum has fallen further than Bitcoin and recovered better of late. What chart structure, the fee mechanism and trading volume say about buying at current prices.
August 11, 2026 5:35 PM

Is Bitcoin a Good Buy at Current Prices?
Bitcoin trades about a third below its twelve-month high and has reclaimed both moving averages. What chart structure, RSI and trading volume say about buying at current prices.
August 3, 2026 10:41 AM
Is XRP Coin a Good Buy At Current Prices?
XRP trades at $1.4797 and is holding above the 200-day EMA. Why that line at $1.3894 now decides, as support, whether the reversal holds.
June 18, 2026 10:57 PM
Is Solana (SOL) a Good Buy at Current Prices?
Solana has traded above its 200-day average since August, the 50-day average joined it on 21 September, and volume is now keeping pace. What chart structure, issuance and tokenisation say about buying at current prices.
May 12, 2024 4:17 PM

Toncoin Price Prediction: Will TON Price reach $10?
Despite the bearish crypto market, Toncoin continues to make higher highs, reaching an ATH price of more than $7. How high will TON price reach?

October 1, 2024 11:05 AM
Toncoin (TON) Price Analysis: Will TON Price Continue To Surge?
Toncoin's price is on the rise as more users jump in, driven by the growing buzz around the Telegram Airdrop.
September 20, 2026 9:21 AM

Is Ethena a Good Buy at Current Prices?
Ethena has rebounded hard off its twelve-month low and still trades far below its high. Is ENA a good buy at current prices? We check the chart, the supply schedule and the source of the yield with our own price data.
August 27, 2026 11:25 AM

Is Pump.fun a Good Buy at Current Prices?
PUMP has cleared both its 200-day and its 50-day average, yet it still trades well below its twelve-month high. We check with our own price data what argues for and against buying Pump.fun at the current price.
August 27, 2026 6:38 AM

Is NEAR Protocol a Good Buy at Current Prices?
NEAR has worked its way back above both of its moving averages while still trading well below its twelve-month high. We check with our own price data what speaks for and against an entry at current prices.
August 27, 2026 6:23 AM

Is Bittensor a Good Buy at Current Prices?
Bittensor has pulled well clear of its twelve-month low but keeps running into its 200-day average. We check what our own calculations from 365 daily closing prices say about buying TAO at current prices.
August 27, 2026 3:39 AM

Is Cronos a Good Buy at Current Prices?
Cronos has reclaimed its 200-day line for the first time since the spring, and the RSI is back out of overbought. We weigh what speaks for and against buying CRO at the current price.
August 26, 2026 4:21 AM

Is Uniswap a Good Buy at Current Prices?
Uniswap has cleared both of its main moving averages for the first time in months, yet momentum readings are running hot. We weigh what speaks for and against buying UNI at the current price, using our own calculations.
May 18, 2026 1:07 PM

Is Solana a Good Buy in 2026? SOL Price Analysis and Potential ROI
Solana (SOL) trades at $119.48 after clearing the $100 resistance. Here's how SOL's potential returns stack up against BTC, ETH, and XRP.
March 12, 2024 6:08 AM

Toncoin is Climbing: How High Can the TON Price Go?
Could it possibly reach $5 in the near future? How high can the TON price go? Let's take a look at this Toncoin price prediction

June 6, 2026 1:44 AM

Toncoin Crashes to $1.53 as Key Ecosystem Services Face Major Outages
Toncoin (TON) price has crashed sharply to $1.53 amid widespread infrastructure issues, leaving major mini-apps and network portals completely offline.
February 11, 2026 7:05 AM
5 Things to Look for BEFORE Buying Bitcoin
Thinking about entering the crypto market? Discover the 5 essential factors to check before you buy Bitcoin to secure your investment and strategy.
September 5, 2024 10:00 PM
Toncoin Price Drop Below Its $4.70 Support Level Warns Of A Major Crash On The Horizon
Can Toncoin recover from its shaky position, or is a 45% price drop looming? Analysts weigh in on the crypto’s critical support level amid legal troubles at Telegram...
September 19, 2026 4:20 PM

Is Ondo a Good Buy at the Current Price?
Ondo trades above both moving averages and far below its twelve-month high. We examine the chart position, trading volume and supply mechanics, and set out what argues for and against buying the ONDO token.
August 31, 2026 11:20 PM

Is Mantle a Good Buy at Current Prices?
Mantle has rebounded hard from its summer low but still trades below its 200-day line, and nearly half the eventual supply has yet to reach the market. We weigh what speaks for and against buying MNT at the current price.
August 29, 2026 4:26 PM
Is Aster a Good Buy at Current Prices?
Aster sits above both moving averages and at the same time far below its high since listing. We assess whether the token is a good buy at the current price and why the supply still to be released remains the weightiest objection.
More from CryptoTicker