
Is Mantle a Good Buy at Current Prices?
Mantle has rebounded hard from its summer low but still trades below its 200-day line, and nearly half the eventual supply has yet to reach the market. We weigh what speaks for and against buying MNT at the current price.





Which topics should we dive deeper into?
Select what genuinely interests you. Your picks feed directly into our editorial planning.
Crypto news that's actually worth your time.
Weekly. 60 seconds. Carefully curated by our editors: no hype, no promo flood, no spam.
Mantle (MNT) trades at 0.5659 US dollars, and that single figure carries two stories at once. Measured against the twelve-month high of 2.6896 dollars from 9 October 2025, the token is down 79.0 percent. Measured against the twelve-month low of 0.3921 dollars, set as recently as 1 August 2026, it is up 44.3 percent. Anyone asking whether Mantle is a good buy at current prices is really asking which of those two numbers describes the present more accurately.
cryptoticker.io collected the price data for this analysis itself on 31 August 2026. The market data comes from CoinMarketCap; the moving averages, the relative strength index and the twelve-month extremes were calculated from daily closing prices using standard formulas. The series covers a full 365 daily closes, so the high and the low are genuine twelve-month values.
Mantle price analysis: where the MNT price stands right now
Mantle is the 41st-largest cryptocurrency by market capitalisation, worth 1.87 billion dollars. The token has gained 6.2 percent in 24 hours and 5.7 percent over seven days, and the thirty-day figure is the striking one: plus 42.6 percent. Stretch the window and the direction reverses, to minus 15.0 percent over ninety days and minus 52.4 percent over the full year.
Three marks frame the current chart. The support that matters is the August low at 0.3921 dollars, the level from which the present recovery started. The current zone sits between 0.55 and 0.58 dollars, where the token has spent the past several sessions. Above that lies the 200-day exponential moving average at 0.6416 dollars, roughly 11.8 percent above the current price and the nearest meaningful resistance.
The 50-day exponential moving average sits at 0.4656 dollars, some 21.5 percent below the current price. A market standing a fifth above its own fifty-day average is not resting; it is extended.
Is the Mantle downtrend broken or only interrupted?
By the strictest reading, the downtrend is intact. The price remains below the 200-day line at 0.6416 dollars, and the twelve-month chart still shows a sequence of lower highs: 2.6896 dollars in October 2025 was never approached again, and each rally since topped out beneath the one before it.
By a shorter reading, something has changed. The August low at 0.3921 dollars held, the price has reclaimed the 50-day average at 0.4656 dollars, and it has held above it rather than falling straight back. That is the minimum requirement for a trend change, though it is nowhere near sufficient proof of one.
The honest description is an interruption that could become a break, and the threshold is specific rather than a matter of opinion. A sustained daily close above 0.6416 dollars, followed by a pullback holding that level as support, would turn the interruption into a broken downtrend. A drop back below 0.4656 dollars would mark the past month as a rebound inside an intact decline.
What RSI and moving averages mean for a Mantle entry
The 14-day relative strength index stands at 63.5, below the 70 mark conventionally read as overbought but in the upper third of the range, and far from the readings below 30 that mark genuine capitulation. Whoever buys here is not buying into a panic; they are buying into a market that has already run.
The two moving averages say the same thing from another angle. The 50-day average at 0.4656 dollars is still below the 200-day average at 0.6416 dollars, a configuration chart analysts call a death cross, and it has not yet resolved. For entry timing that leaves a clear picture: the momentum indicators are constructive, the trend indicators are not yet, and they disagree because they measure different horizons. An entry here is a bet that the shorter one proves right.
What trading volume reveals about demand for Mantle
Mantle turned over 52.4 million dollars in the past 24 hours against a market capitalisation of 1.87 billion, a daily turnover of 2.80 percent of the token's own market value.
Turnover decides whether a position can be exited near the quoted price. Several tokens of comparable size turn over a fraction of a percent per day, so a mid-sized sell order moves the price against the seller before it is filled. Mantle does not have that problem: at 2.80 percent the market is deep enough that ordinary retail positions can be closed without the exit itself becoming the risk.
The volume also corroborates the price move. A 42.6 percent monthly gain on thin volume would suggest the price rose on an absence of sellers rather than a presence of buyers. That is not the case here. Whether the demand persists is a question no volume figure can answer in advance.
Which structural factors speak for Mantle
Mantle is a layer-2 network built on Ethereum, and MNT is its native token, used to pay transaction fees and to vote in governance. That places the token downstream of two things: how much activity settles on layer-2 networks generally, and how much of it lands on Mantle rather than on its well-funded competitors. The Ethereum roadmap is therefore a relevant document for MNT holders, since the base layer sets the conditions every layer-2 operates under.
The supply mechanics are the most consequential structural fact, and they cut both ways. Of a total supply of 6,219,316,795 MNT, some 3,302,294,383 are in circulation, or 53.1 percent. That reserve funds development without selling into the open market at every turn, but every token that eventually enters circulation is supply the market must absorb at some price. A buyer today is buying a token whose circulating supply can still roughly double.
Regulation is the third factor, and for European buyers not a theoretical one. The MiCA framework governs how crypto assets may be offered in the European Union, and the supervisory positions published by the European Securities and Markets Authority shape which venues may serve EU customers. That matters less for the price than for the practical question of where the token can be bought and held.
What speaks for buying Mantle at the current price
First, the short-term trend has turned. The price at 0.5659 dollars stands 21.5 percent above the 50-day average of 0.4656 dollars, and the August low at 0.3921 dollars held when it was tested. Whatever the twelve-month chart says, the last four weeks belonged to the buyers.
Second, the market is liquid enough to leave. A daily turnover of 2.80 percent of market capitalisation means the exit exists. That sounds like a modest virtue until the moment it is needed, at which point it becomes the only one that matters.
Third, the discount against the high is real. At 79.0 percent below 2.6896 dollars, the token is priced far from its own best case. If the layer-2 thesis holds, the current price reflects a great deal of pessimism. That conditional is doing heavy lifting, and it is the assumption the whole constructive case rests on.

What speaks against buying Mantle at the current price
First, the long-term trend has not turned. The price is 11.8 percent below the 200-day average of 0.6416 dollars, and the 50-day line remains beneath the 200-day line. Every rally of the past twelve months failed at a lower level than the one before it, and this one has not yet proved itself different.
Second, 46.9 percent of the supply is not yet circulating. Roughly 2.9 billion MNT sit outside the traded float. The pace at which they enter is not something an outside buyer controls or can forecast, and every tranche has to be absorbed by demand that does not yet exist.
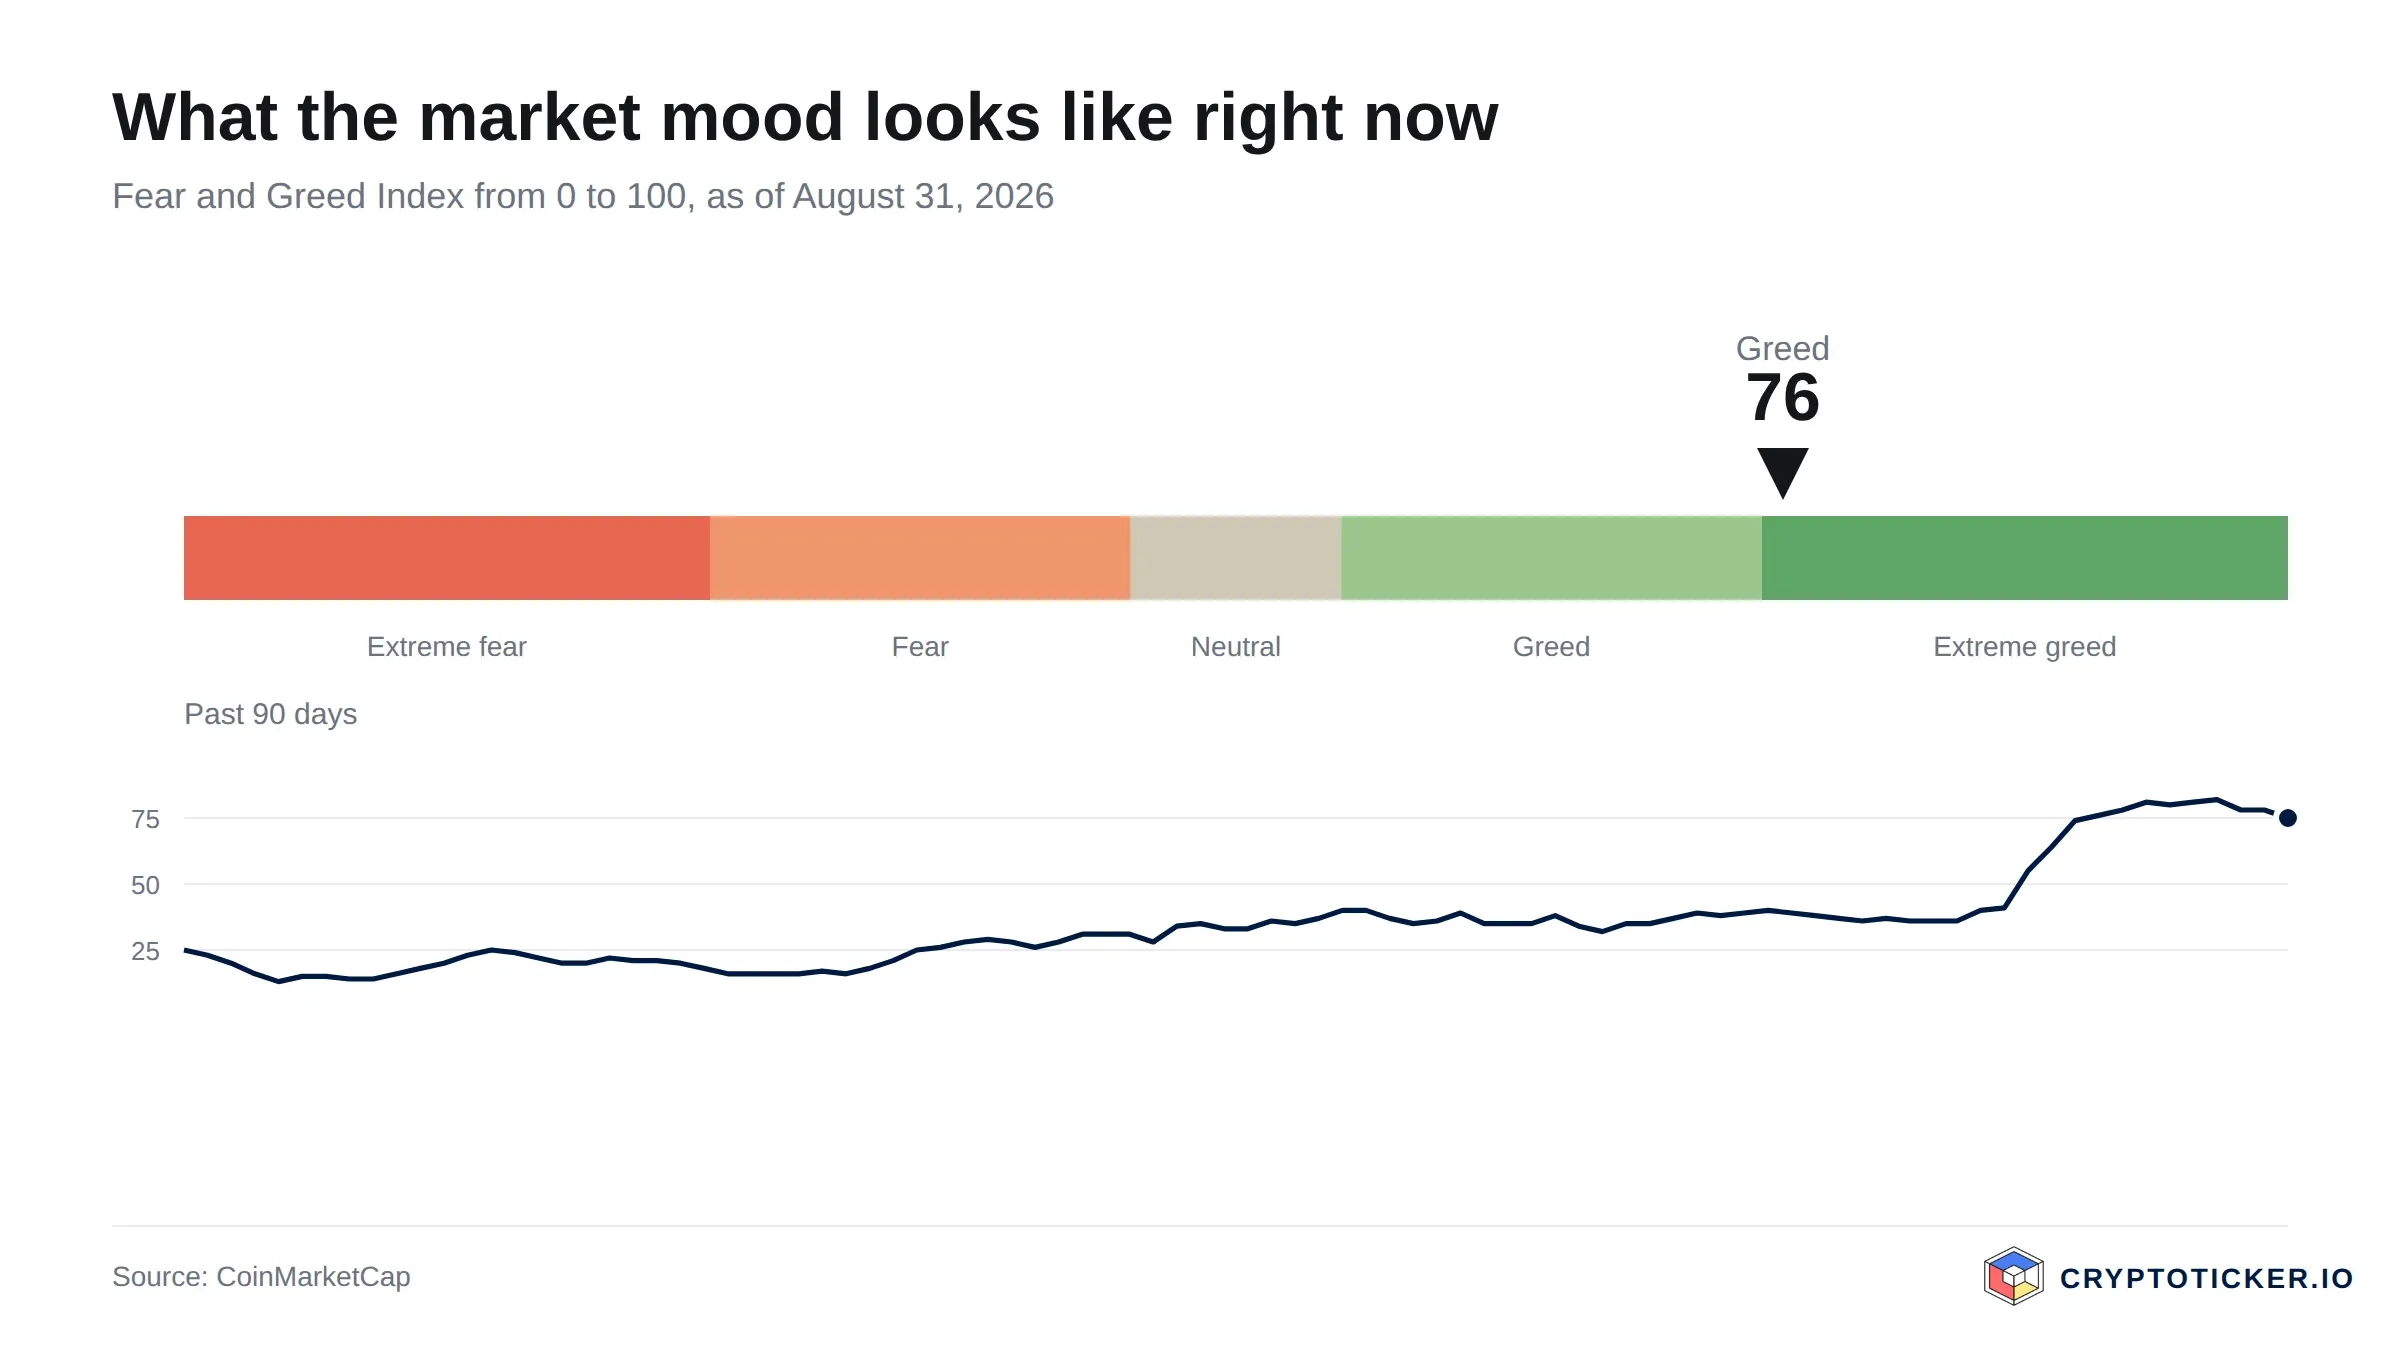
Third, the entry point is a run, not a dip. Buying after a 42.6 percent monthly gain at an RSI of 63.5 means paying up for a move that has largely happened. The market-wide Fear and Greed Index stands at 75, in greed territory, which is the sentiment reading under which the worst entry prices are usually paid. None of that makes a further rise impossible; it makes the risk-reward less favourable than it was a month ago.
A fourth point belongs alongside them: layer-2 networks are a crowded field, and Mantle's share of it is not guaranteed. The token has no value independent of that share.
How you can buy Mantle at the current price
MNT is listed on most large centralised exchanges. What differs is fees, regulatory standing and what happens to the token after the purchase. Trading fees at the major venues typically run between 0.1 and 0.5 percent per order for retail volumes, and the spread adds to that.
Regulatory standing is the second criterion, and for EU buyers the more practical one. Our comparison of regulated crypto exchanges sets out which venues hold which permissions; the individual assessments are in our Kraken review and our Bitpanda review.
Custody is the decision most buyers postpone and should not. Tokens left on an exchange are held by the exchange, and that counterparty risk is not hypothetical. For positions meant to be held rather than traded, a hardware wallet moves the keys into the buyer's own hands; our hardware wallet comparison covers the devices that support this class of token. MNT is an Ethereum-based token, so wallets supporting Ethereum and its layer-2 networks will generally hold it.
One note on order type: given that 6.2 percent in a single day is ordinary here, a limit order rather than a market order is the difference between the price you chose and the price you got.
Is Mantle a good buy at current prices?
The answer differs by horizon, and collapsing the two is where most of the confusion comes from.
Short term, the numbers are unattractive. An RSI of 63.5 after a 42.6 percent monthly gain, a price 21.5 percent above its own 50-day average of 0.4656 dollars, and a sentiment reading of 75 in greed territory together describe an extended market, not a cheap one. The nearest resistance at 0.6416 dollars is 11.8 percent away, while the nearest real support at 0.3921 dollars is 30.7 percent below. That asymmetry is arithmetic rather than opinion.
Long term, the case is genuinely open and rests on one question: whether Mantle holds a meaningful share of layer-2 activity as that sector matures. If it does, a price 79.0 percent below the twelve-month high of 2.6896 dollars is an entry into a discounted asset. If it does not, the supply still to enter circulation will meet demand that never arrives.
The constructive case is therefore falsifiable, and the conditions are worth stating plainly. It would be refuted by a sustained fall below 0.4656 dollars, by a failure at 0.6416 dollars followed by a lower high, or by evidence that activity is migrating to competing networks. It would be supported by a daily close above 0.6416 dollars that holds on the retest, and by the 50-day average crossing above the 200-day. None of this is a recommendation either way.
Buying Mantle: what to take away
- The two horizons disagree, and that is the whole story. Mantle at 0.5659 dollars sits above its 50-day average of 0.4656 dollars and below its 200-day average of 0.6416 dollars. The short-term trend has turned, the long-term one has not. The same tension is worth checking on the base layer every layer-2 depends on: whether Ethereum is a good buy at current prices.
- The supply overhang is the number to watch, not the chart. With 53.1 percent of 6,219,316,795 MNT in circulation, nearly half the eventual supply has yet to reach the market, a structural headwind no support level offsets. The same question in sharper form applies to recently listed tokens: whether Aster is a good buy at current prices.
- Liquidity and entry discipline decide more than the thesis does. At 2.80 percent daily turnover the exit exists; at an RSI of 63.5 and a Fear and Greed reading of 75, paying up with a market order is the avoidable mistake. For how the same indicators read on the most liquid asset in the market, see whether Bitcoin is a good buy at current prices.
Disclosure: Some of the providers mentioned in this article work with us through partner programmes. This has no influence on the price analysis or on the assessment of the chart situation; the price data comes from a public market data source and can be verified there.
(As of 31 August 2026. This article is not investment advice. Prices, fees and terms change; check them with the provider yourself before every purchase. Crypto assets are subject to high price volatility, and a total loss is possible.)
Transparency note: This article was produced with the assistance of artificial intelligence and reviewed by our editorial team before publication. All figures and claims were checked against the primary sources linked in the text. The feature image was generated with AI.
Related articles
Which topics should we dive deeper into?
Select what genuinely interests you. Your picks feed directly into our editorial planning.
Crypto news that's actually worth your time.
Weekly. 60 seconds. Carefully curated by our editors: no hype, no promo flood, no spam.

August 27, 2026 6:23 AM

Is Bittensor a Good Buy at Current Prices?
Bittensor has pulled well clear of its twelve-month low but keeps running into its 200-day average. We check what our own calculations from 365 daily closing prices say about buying TAO at current prices.
August 27, 2026 4:31 AM

Is AAVE a Good Buy at Current Prices?
AAVE has worked its way back above both the 200-day and the 50-day moving average, yet still trades far below its twelve-month high. Using our own price data, we examine what speaks for and against an entry at current prices.
August 27, 2026 3:39 AM

Is Cronos a Good Buy at Current Prices?
Cronos has reclaimed its 200-day line for the first time since the spring, and the RSI is back out of overbought. We weigh what speaks for and against buying CRO at the current price.
August 27, 2026 3:24 AM

Is Hedera a Good Buy at Current Prices?
HBAR has bounced off its twelve-month low but still trades well below its long-term average. We weigh moving averages, RSI and volume to judge whether Hedera is a good buy at the current price.
August 27, 2026 2:21 AM

Is SUI a Good Buy at Current Prices?
SUI has reclaimed its 200-day moving average and trades 79 percent above its twelve-month low. We check whether the coin is a good buy at current prices.
August 26, 2026 4:21 AM

Is Uniswap a Good Buy at Current Prices?
Uniswap has cleared both of its main moving averages for the first time in months, yet momentum readings are running hot. We weigh what speaks for and against buying UNI at the current price, using our own calculations.
August 16, 2026 12:21 PM

Is Toncoin a Good Buy at Current Prices?
Toncoin has reclaimed both of its moving averages and now goes by the name Gram. We weigh what the chart, the RSI and the recovery in trading volume say for and against buying at current prices.

May 18, 2026 1:07 PM

Is Solana a Good Buy in 2026? SOL Price Analysis and Potential ROI
Solana (SOL) trades at $119.48 after clearing the $100 resistance. Here's how SOL's potential returns stack up against BTC, ETH, and XRP.
May 13, 2026 11:02 AM

Is PEPE Coin worth Buying in 2026?
PEPE has reclaimed both its 50 day and its 200 day average, with trading volume back at its yearly norm. What that means for anyone buying at current prices, and the two levels that settle it.
September 28, 2026 9:47 AM
XRP Price Drops Below $1.50: Where Is Ripple Heading This Week?
XRP price slips under $1.50 after a red weekend. Here is the XRP price analysis with the higher and lower targets that matter this week.
August 23, 2026 1:16 AM

Is PEPE a Good Buy at the Current Price?
PEPE is back above both moving averages and the 50-day has crossed the 200-day. Is the memecoin a good buy at the current price, or is the rally already running on thin volume?
August 24, 2026 12:50 AM
Is Bitcoin Cash a Good Buy at Current Prices?
Bitcoin Cash has rallied hard off its June floor, but it still trades below its long-term trend line with the RSI stretched. We work through what speaks for and against buying BCH at current prices.
August 24, 2026 12:34 AM
Is Monero a Good Buy at Current Prices?
Monero holds above both of its long-term averages after a strong summer, yet still trades far below its twelve-month high. We look at what the trend, the turnover and the regulatory picture mean for anyone weighing a purchase of XMR now.
August 24, 2026 12:19 AM

Is Zcash a Good Buy at Current Prices?
Zcash has run far ahead of its own long-term averages after a week that changed the chart. We look at what the trend, the RSI and the turnover actually support, and under which conditions the case for buying ZEC breaks down.
August 23, 2026 2:21 PM

Is Hyperliquid a Good Buy at Current Prices?
HYPE set its twelve-month high in September and has given part of it back, with the RSI now neutral. We weigh chart, RSI, trading volume and supply mechanics to see what argues for and against buying Hyperliquid at current prices.
August 11, 2026 5:35 PM

Is Ethereum a Good Buy at Current Prices?
Ethereum has fallen further than Bitcoin and recovered better of late. What chart structure, the fee mechanism and trading volume say about buying at current prices.
August 11, 2026 5:35 PM

Is Bitcoin a Good Buy at Current Prices?
Bitcoin trades about a third below its twelve-month high and has reclaimed both moving averages. What chart structure, RSI and trading volume say about buying at current prices.
August 3, 2026 10:41 AM
Is XRP Coin a Good Buy At Current Prices?
XRP trades at $1.4797 and is holding above the 200-day EMA. Why that line at $1.3894 now decides, as support, whether the reversal holds.
June 18, 2026 10:57 PM
Is Solana (SOL) a Good Buy at Current Prices?
Solana has traded above its 200-day average since August, the 50-day average joined it on 21 September, and volume is now keeping pace. What chart structure, issuance and tokenisation say about buying at current prices.
May 15, 2026 9:47 AM

Top 10 Altcoins to Buy in May 2026 as Bitcoin Recovers
Here are the top 10 altcoins to buy in May 2026 as Bitcoin rebounds near $80K and market momentum shifts.

April 6, 2026 6:24 PM
Ethereum Price Analysis: ETH Consolidates Between $1,800 and $2,100, What’s Next?
Ethereum price is stuck in a tight range between $1,800 and $2,100. Analysts warn of a decisive breakout or breakdown as volatility reaches a boiling point.
February 26, 2026 4:18 PM

Cardano Price Analysis: ADA Jumps 8% as Bulls Eye $0.30 Breakout
Cardano (ADA) surges 8% to $0.29. Analysts eye the $0.30 resistance as a make-or-break point for the next major price move toward $0.35.
July 21, 2025 5:00 AM

Cardano Price Prediction: ADA Finally Wakes Up After Bitcoin ATH
Cardano has been lagging — until now. While Bitcoin topped out weeks ago, ADA is just starting to move. What’s next for the ADA price?

October 3, 2026 4:13 AM

OKB at $120, X Layer 10 Percent Below Its Capital Peak: Why One Lending Market Holds 68 Percent
OKB trades at $120.25 after an unusually quiet week. X Layer holds $168.3 million in deposits according to our own survey, and 68 percent of that sits in a single lending market.
May 2, 2026 8:43 AM
Top 5 Cryptocurrencies to Buy in May 2026: Altcoin Season Next?
May 2026 starts with Bitcoin leading the charge above $78k. While some altcoins lag, others present unique accumulation opportunities for investors.
More from CryptoTicker