
Is Canton a Good Buy at Current Prices?
Canton ranks 21st in the market and has handed back most of its late-September rally, slipping below its 200-day average again on thinning turnover. What speaks for and against buying CC, and which levels decide the case.





Which topics should we dive deeper into?
Select what genuinely interests you. Your picks feed directly into our editorial planning.
Crypto news that's actually worth your time.
Weekly. 60 seconds. Carefully curated by our editors: no hype, no promo flood, no spam.
Canton (CC) changes hands at 0.1236 US dollars, some 34.3 percent below its record high of 0.1882 dollars from 3 February 2026, after losing 7.7 percent over the past week and adding 2.9 percent in the last 24 hours. The token sits 21st by market capitalisation at 4.92 billion dollars and now trades 1.3 percent below its 200-day average, having briefly reclaimed that line at the end of September. That round trip frames the question: whether the late-September move was a market rediscovering Canton, or a rally in a thin book that the adoption case never justified.
cryptoticker.io collected the price data behind this analysis on 4 October 2026. The source is market data from CoinMarketCap and CoinGecko, queried through the numeric asset ID rather than the ticker, because the symbol CC is assigned to more than a dozen separate listings. The method is daily closing prices and standard formulas for moving averages and the 14-day relative strength index. One limitation belongs in the open: the daily series begins on 10 November 2025 and covers 330 closes, so the figures below described as the twelve-month high and low are extremes since the token began trading, not a full annual cycle.
Canton price analysis: where the CC price stands and which levels matter
The current Canton price of 0.1236 dollars now sits between the two averages. The 50-day average stands at 0.1155 dollars, 7.0 percent below spot, which measures how much of the September move survives. The 200-day average stands at 0.1252 dollars, 1.3 percent above spot, and that is the line the market failed to reclaim through the summer, took back at the end of September and has now given up again.
The twelve-month high of 0.1882 dollars was set on 3 February 2026, when the token first pushed into the upper ranks of the market. The twelve-month low of 0.0623 dollars dates from 6 December 2025. Canton trades 98.6 percent above that low and 34.3 percent below the high, in the upper half of its short history.
The practical levels follow from those numbers. The 200-day line near 0.1252 dollars has flipped back to resistance and is the one that decides whether the September move was a trend change or a spike, and the 50-day line at 0.1155 dollars is the support a deeper retracement would test first. Above that, the market has no reference until the 0.1882 dollar high, and that thinness of reference is itself a risk.
Is the Canton downtrend broken or merely interrupted?
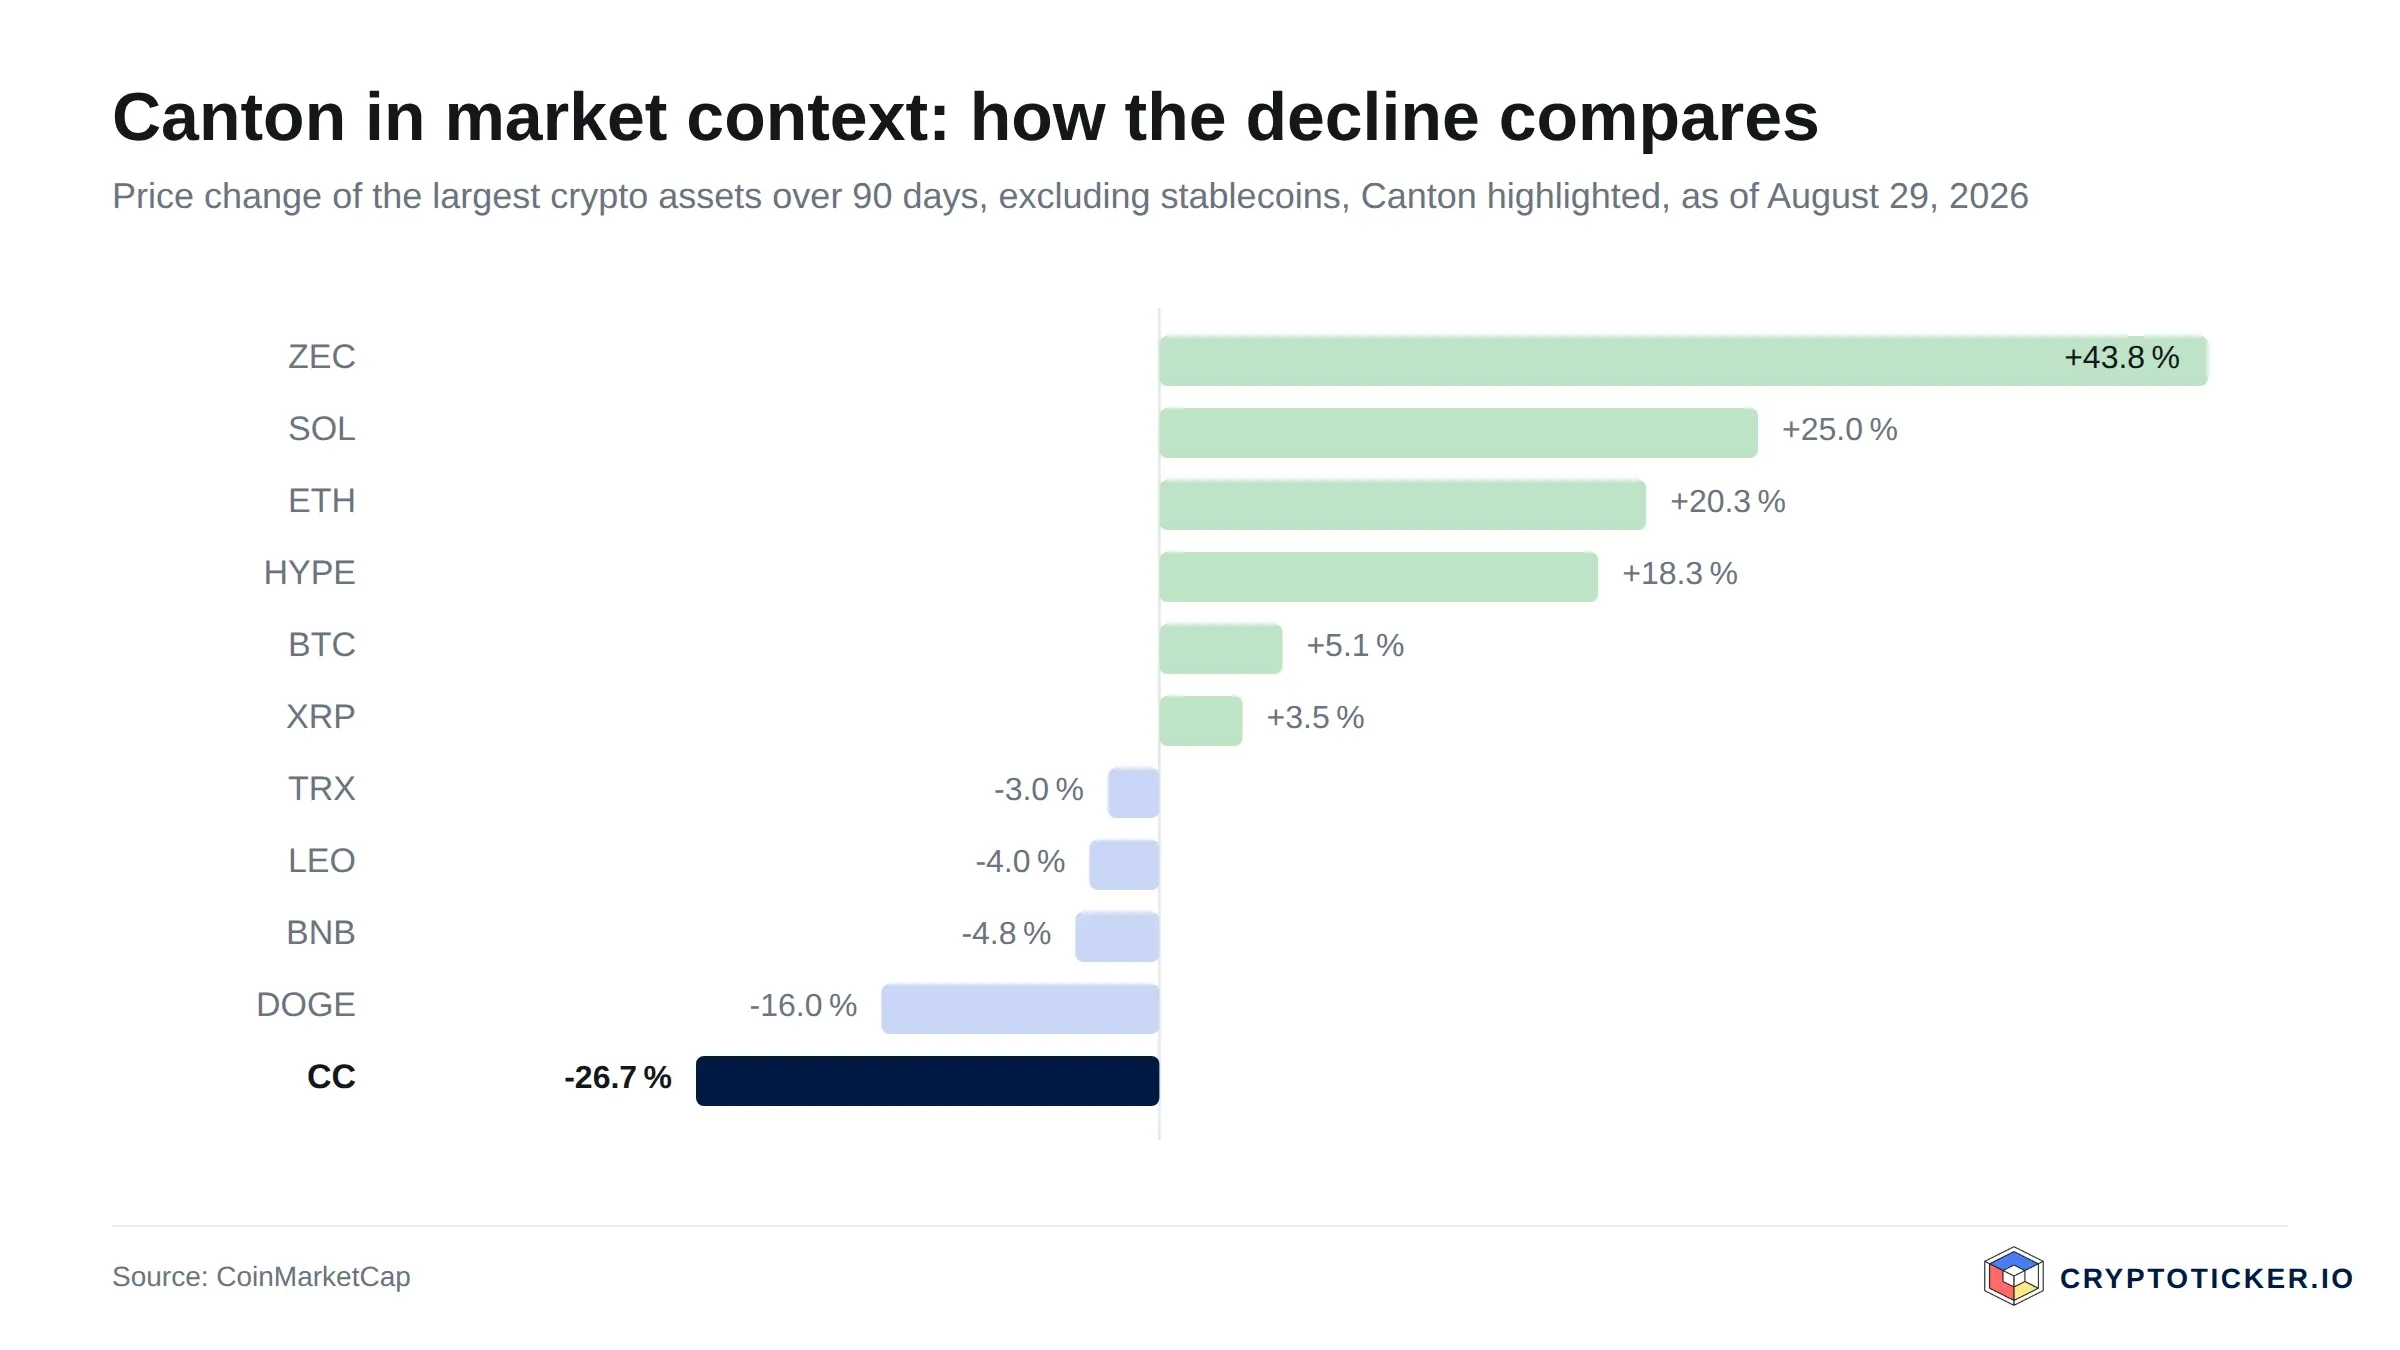
On the evidence, it is interrupted, and the interruption is losing force. Canton is down 13.1 percent over 90 days, the last 30 days still add 11.4 percent, but the last seven days took 7.7 percent back off and the last 24 hours returned 2.9 percent. A price 7.0 percent above the 50-day average describes a market that turned sharply in late September and has since handed back most of it.
The technical definition of a broken downtrend is a close above the 200-day average that holds. At 0.1252 dollars, that line now sits 1.3 percent above spot, so the test that looked half met in September has been failed: the holding never came, and the 50-day average remains 7.7 percent below the 200-day.
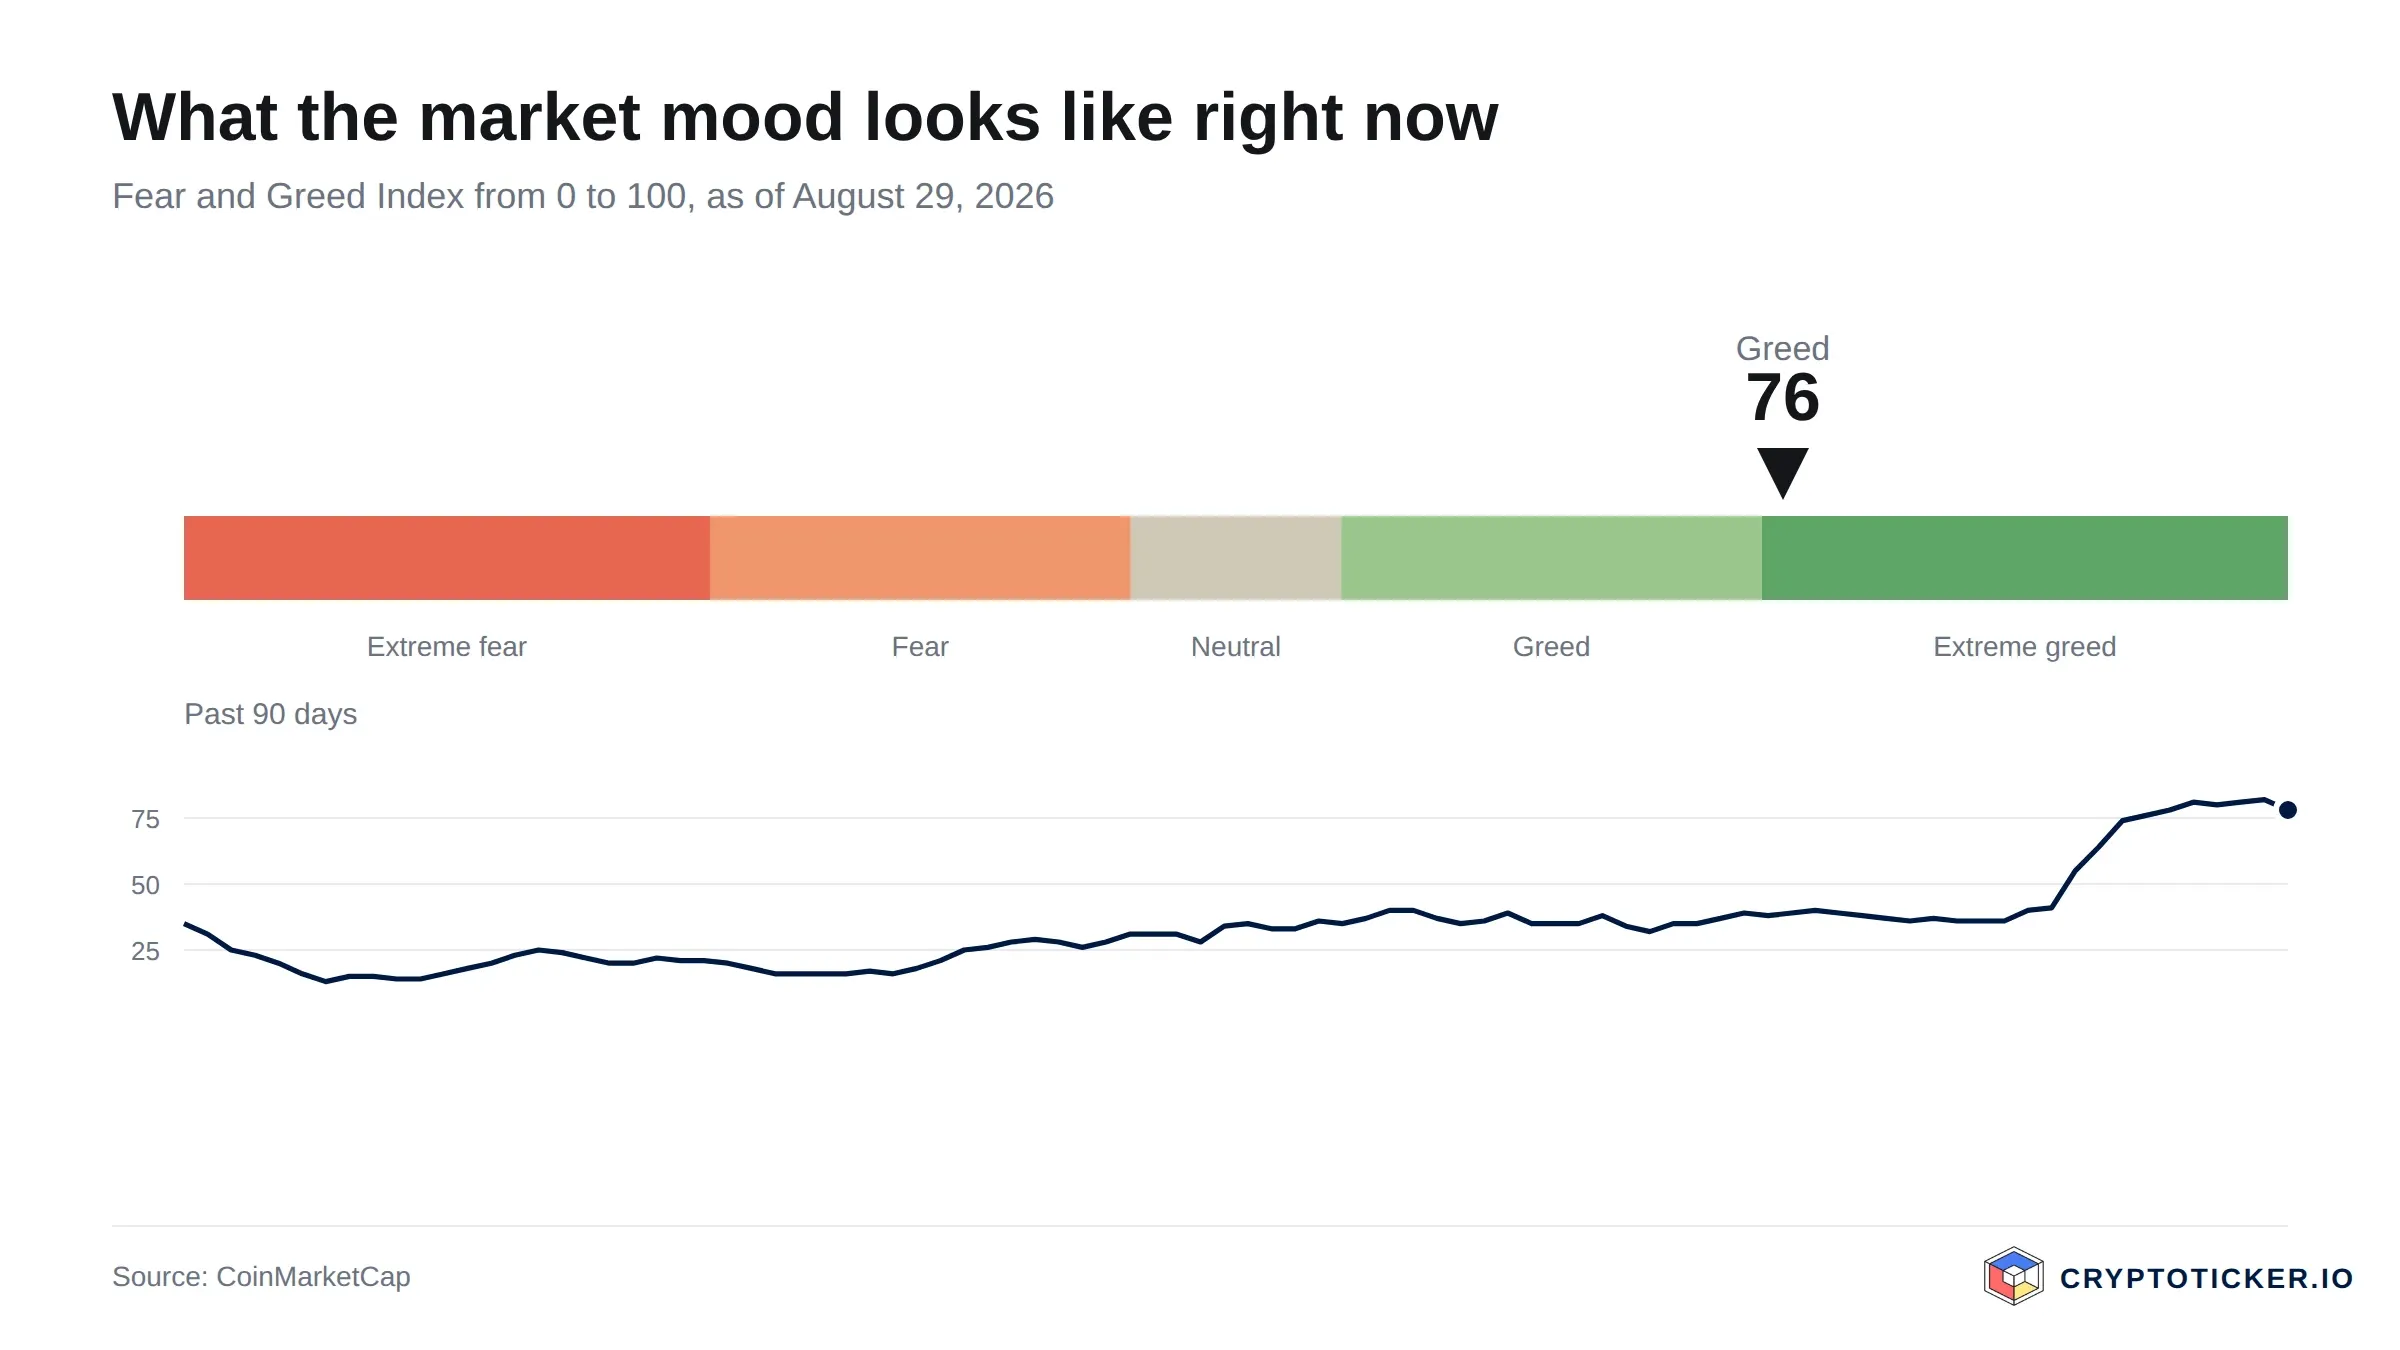
A second reading belongs here as a supposition rather than a finding. Canton fell through the spring while the CoinMarketCap Fear and Greed Index moved into greed territory, where it currently reads 67. An asset drifting lower while sentiment elsewhere is bullish suggests selling specific to this token rather than general risk aversion. The interpretation fits the data, but the series is too short to treat it as established.
What RSI and moving averages mean for a Canton entry
The 14-day relative strength index reads 55.5, still short of the overbought threshold at 70 and far from the oversold threshold at 30 despite the pullback. It offers no oversold signal that would mark a bounce and no overbought reading that would warn against buying.
The moving averages are more informative because they disagree with each other. Price above the 50-day but back below the 200-day, with the 50-day itself 7.7 percent under the 200-day, is the signature of a counter-move inside a medium-term downtrend that has already lost its best level, and the RSI at 55.5 gives no hint which way it resolves.
The practical consequence is that the chart supports staging rather than a single decision. An investor who intends to hold Canton can treat a reclaim of the 0.1252 dollar area, held for several closes, as confirmation of a trend change, and a fall through the 0.1155 dollar area as evidence the move was a spike, and size the position accordingly. That is a framework, not a recommendation. The same method is applied to a larger asset in our analysis of whether Bitcoin is a good buy at current prices.
What trading volume reveals about Canton demand
This is where the analysis turns uncomfortable. Canton turned over 14.9 million dollars in 24 hours against a market capitalisation of 4.92 billion dollars. That is 0.30 percent of the outstanding value changing hands in a day. Turnover has fallen back to roughly a quarter of its late-September level, and for an asset ranked 21st in the market that is thin.
Assets of similar size routinely turn over several percent of their capitalisation daily. A ratio of a third of a percent means the quoted price rests on a very thin book, and thin books move disproportionately when a single large order arrives. September's 18.3 percent daily gain was that mechanism working upward; the give-back since is the same mechanism in reverse. The 4.92 billion dollar valuation is what the market says the token is worth, and comparatively little capital has had to agree on it.
Two consequences follow for a private investor. Entering or leaving a position of any size will move the price against you, so limit orders matter more here than with liquid majors, and they matter more now than they did a week ago. And the valuation is more sensitive to sentiment than the ranking suggests.
Which structural factors speak for Canton
Canton positions itself as a settlement layer for regulated financial institutions, with privacy at the level of individual transactions rather than the full transparency of a public ledger. That design targets institutions wanting the settlement finality of a blockchain without publishing their positions to competitors. Whether the network wins that market is open, but the problem it addresses is genuine and large.
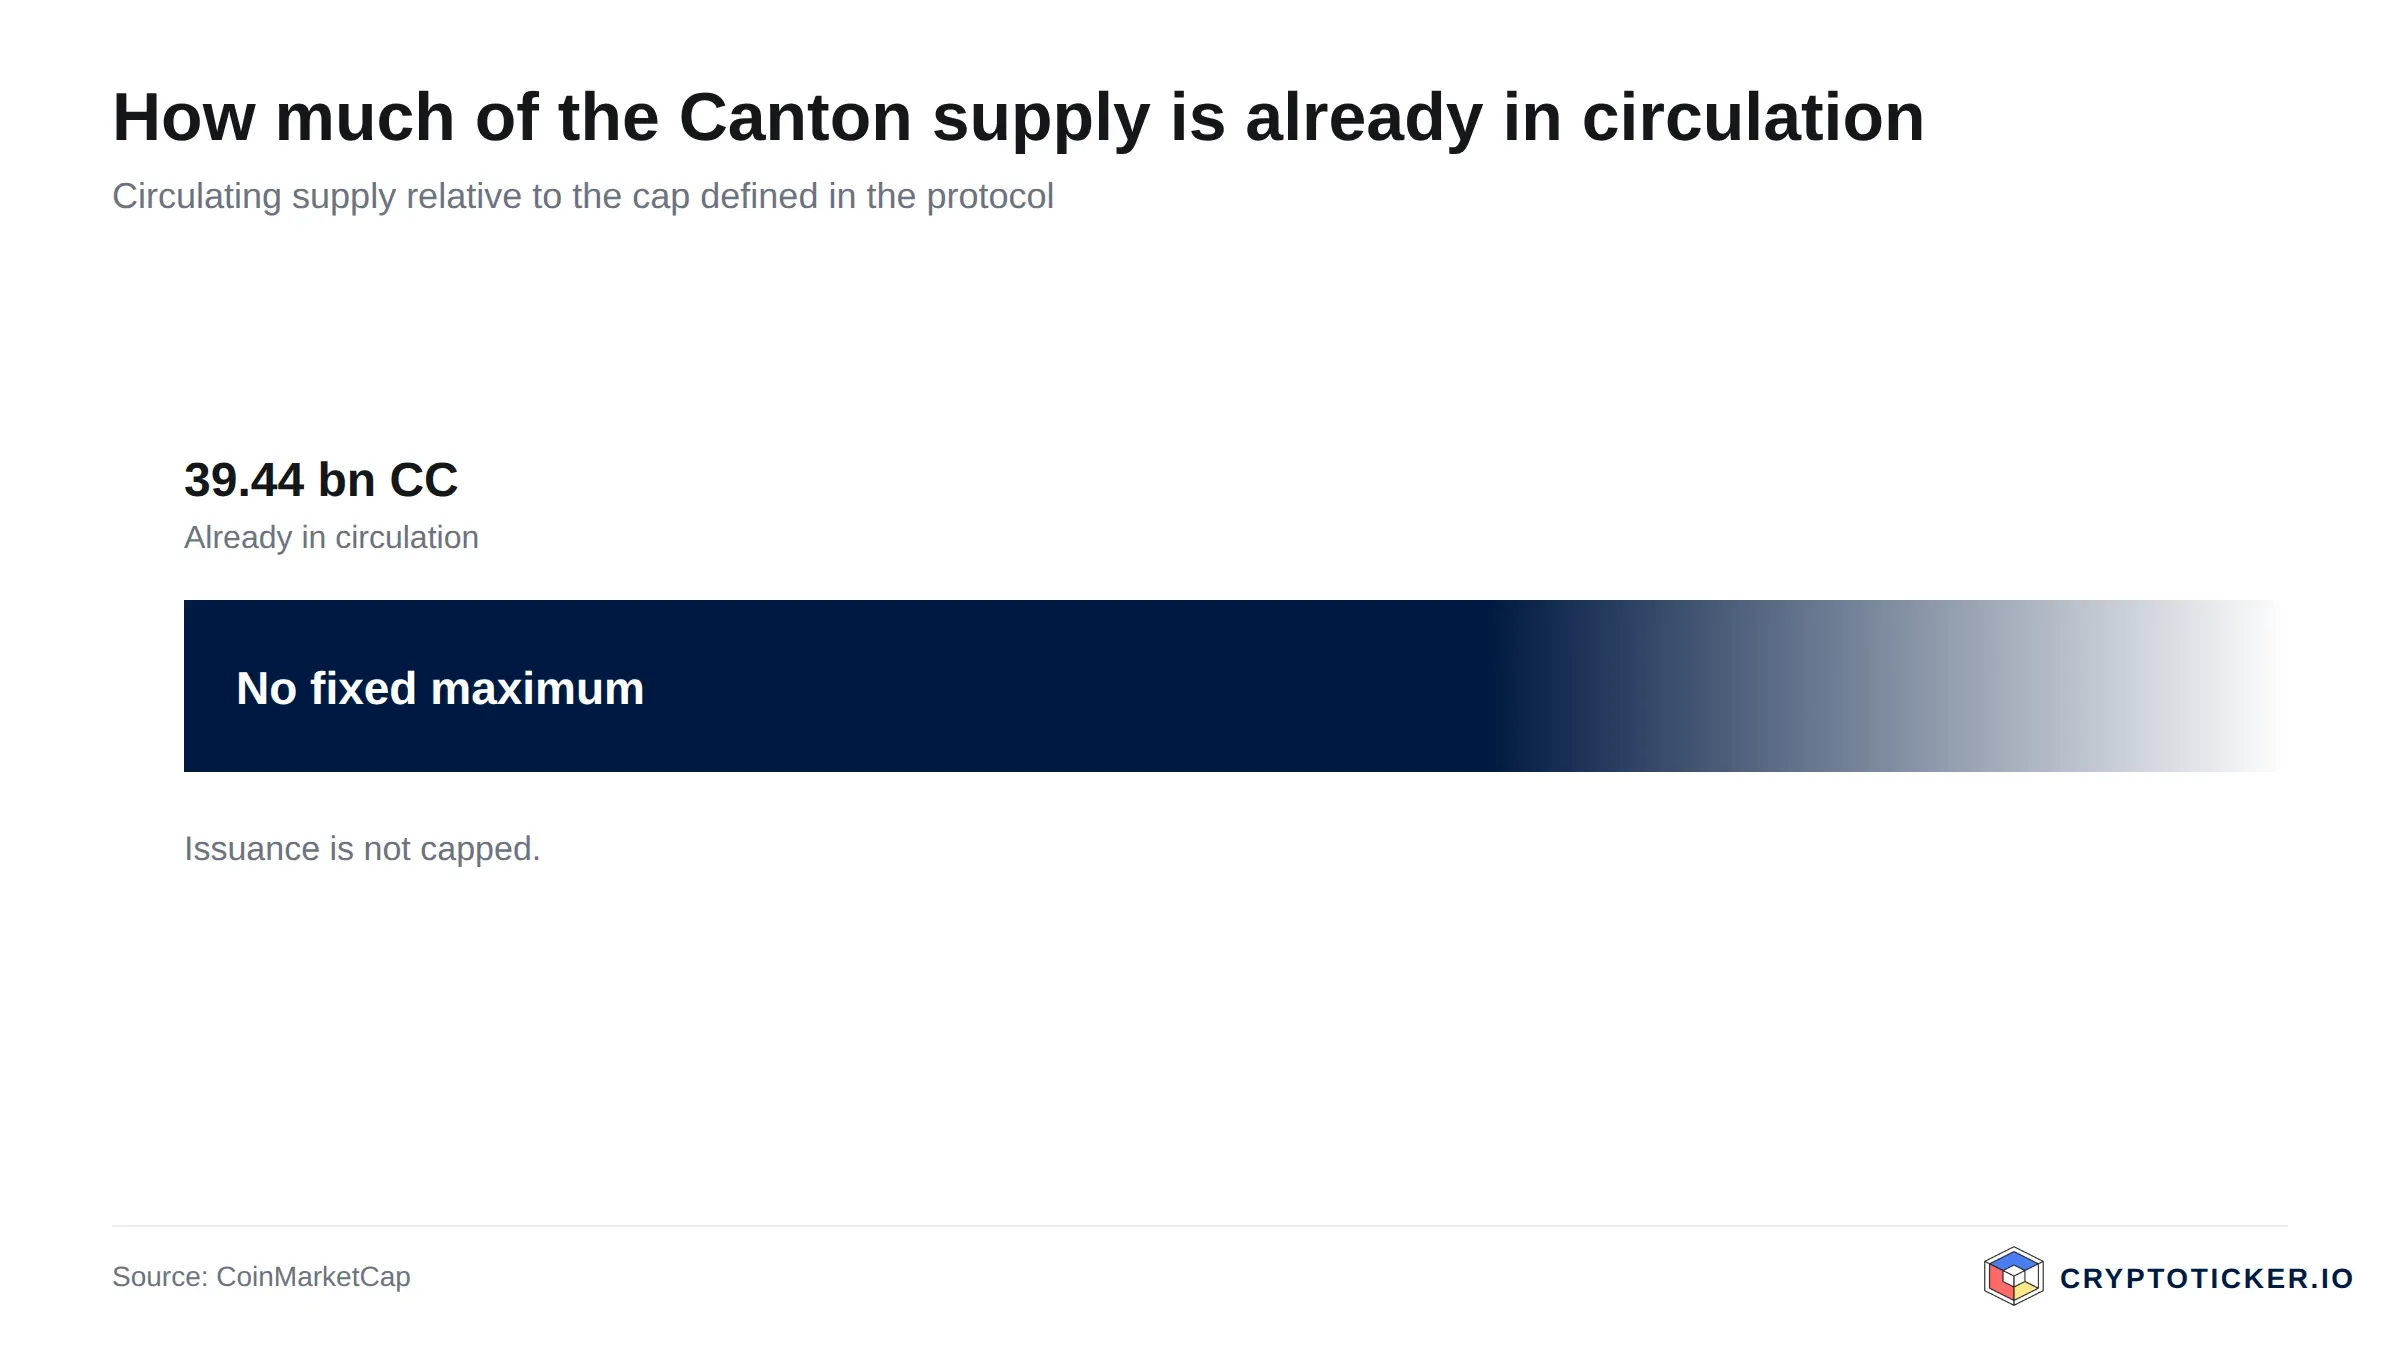
The supply picture is the second structural factor, and it cuts both ways. CoinMarketCap reports 39.76 billion CC in circulation and no fixed maximum, with circulating and total supply identical. The absence of a hard cap distinguishes Canton from the fixed-supply model set out in the original Bitcoin white paper, so the scarcity argument that supports some assets does not apply here in the same form.
The third factor is regulatory fit. A network built for institutional settlement operates in the environment that the European Securities and Markets Authority shapes for European market infrastructure, and institutional adoption of tokenised assets depends more on that framework than on retail sentiment. The Ethereum roadmap documents a different approach to the same finality questions, and Canton's earlier move into the upper ranks was covered in our analysis of the CC breakout.
What speaks for buying Canton at current prices
Three arguments carry weight. The first is the discount to the 200-day average. At 0.1236 dollars against an average of 0.1252 dollars, an investor is buying slightly below the level that has defined the past year of trading, which is where the September buyers did not get in.
The second is that the summer selling demonstrably exhausted itself. A 30-day gain of 11.4 percent against a 90-day loss of 13.1 percent describes a market that ran out of sellers in September, and entering after a 7.7 percent week costs less than entering at the top of that move.
The third is the position in the ranking. A token at rank 21 with a 4.92 billion dollar capitalisation cleared within a year of listing a hurdle that most projects never clear. That is not proof of durability, and it is evidence that the network attracted serious capital rather than only speculative flow.
What speaks against buying Canton at current prices
Three arguments cut the other way, and the first is liquidity. A daily turnover of 0.30 percent of market capitalisation means the price is set by a very small pool of capital. In a sell-off that pool disappears first, and the 0.0623 dollar low from December 2025 shows how far the token can travel when it does.
The second is the length of the record. With 330 daily closes, Canton has traded through one market phase. Every average here, including the 200-day line at 0.1252 dollars, rests on a series that has never seen a full cycle, and the high of 0.1882 dollars is the extreme of a short life rather than of a tested range.
The third is the open supply schedule. With 39.76 billion tokens outstanding and no stated maximum, future issuance is a variable an investor cannot size from the public data. That does not make dilution certain, and the burden of proof sits with the buyer. Investors who prefer longer records and deeper books may find our assessments of XRP and Hedera the more useful comparison.
How to buy Canton at the current price
Availability is the first hurdle and it is not a formality. Canton is a recent listing and coverage across retail venues is uneven, so confirm that a provider actually lists CC before building a plan around it. Our crypto exchange comparison sets out fees and coverage side by side, and the overview of regulated exchanges holding a MiCA licence narrows the field for European buyers.
Costs come in three layers that are easy to underestimate on a thinly traded asset. There is the trading fee, typically a fraction of a percent on the venues in our Kraken review, Bitpanda review and Coinbase review. There is the spread, wider on an asset turning over 0.30 percent of its capitalisation a day than on a major. And there is slippage on market orders, the cost most retail buyers never see itemised, which limit orders address directly.
Custody is the final decision. Leaving tokens with an exchange keeps them available for trading and exposed to the venue, and moving them to self-custody reverses both. Our hardware wallet comparison covers which devices support which networks, a check that matters more for newer chains. Fees and conditions change, so verify them with the provider before buying.
So is Canton a good buy at current prices?
Short term, the chart has turned back. An RSI of 55.5 gives no edge, the price has slipped below the 200-day average again after a 7.7 percent week, and a thin order book means a short-term position pays a spread on the way in and again on the way out. The cost of waiting to see whether 0.1252 dollars is reclaimed and held is low.
Long term, the case rests on a proposition rather than a chart: that regulated institutions will settle tokenised assets on a network of this design, and that the token captures value when they do. An investor who finds that plausible is buying 1.3 percent below the 200-day average of 0.1252 dollars, with the 50-day line at 0.1155 dollars as the first downside reference and the 0.0623 dollar low as the last. An investor who does not has no reason to hold the token at any price, because the technical picture alone does not support a position.
Two of the three tests set out here in September have since been failed: daily turnover has fallen back to 0.30 percent of market capitalisation, and the 0.1252 dollar average has been lost, sending the price back towards the summer range. The third, a supply expansion not matched by network usage, remains open. Closes above 0.1252 dollars holding for several weeks on rising turnover, together with the 50-day average crossing back above the 200-day, would be the evidence on the other side. Our Canton price prediction tracks these levels as they develop.
Buying Canton: what to take away
- Canton trades at 0.1236 dollars, 1.3 percent below its 200-day average of 0.1252 dollars and 7.0 percent above the 50-day average of 0.1155 dollars, between a twelve-month low of 0.0623 dollars and a high of 0.1882 dollars. The September recovery was real, and so is the downtrend that has reasserted itself. The same levels are tracked in our Canton price prediction.
- Liquidity is the binding constraint. A daily turnover of 0.30 percent of a 4.92 billion dollar capitalisation makes the quoted price fragile, so limit orders and staged entries matter more here than with liquid majors, at the fees compared in our crypto exchange comparison.
- The record is short. With 330 daily closes, every average rests on a single market phase, which argues for position sizes an investor can hold through a full cycle and for custody decided in advance, as covered in our hardware wallet comparison.
Disclosure: Some of the providers mentioned in this article work with us through partner programmes. This has no influence on the price analysis or the assessment of the chart situation; the price data comes from a public market data source and can be verified there.
(As of 4 October 2026. This article is not investment advice. Prices, fees and conditions change; check them with the provider yourself before every purchase. Crypto assets are subject to high price volatility, and a total loss is possible.)
Transparency note: This article was produced with the assistance of artificial intelligence and reviewed by our editorial team before publication. All figures and claims were checked against the primary sources linked in the text. The feature image was generated with AI.
Related articles
- CC Canton Token Surges Into Top 20 — Can It Break Into the Top 10 Next?
- RAVE Token Surges 4,000%: What is RaveDAO and How to Trade It?
- This Memecoin Made 100% in 1 Month...Meet MOG Token
- Shiba Inu (SHIB) Price Prediction: Promising Developments In The Near Future?
- Canton Jumps 15.6 Percent to $0.13: What to Check on Trading Volume Before You Order
Which topics should we dive deeper into?
Select what genuinely interests you. Your picks feed directly into our editorial planning.
Crypto news that's actually worth your time.
Weekly. 60 seconds. Carefully curated by our editors: no hype, no promo flood, no spam.

September 21, 2026 7:12 PM

Bittensor Price Up 14 Percent: A Rally Without News
TAO climbs to $287 with no single piece of news behind it. Why that is itself information, how the network works and which number sets Bittensor apart from the other AI tokens.
September 21, 2026 4:19 PM

Arbitrum Up 150 Percent In A Month: Is Robinhood Carrying The Price?
ARB is the strongest performer of the past four weeks. Behind the advance sit Robinhood's own chain and trading in tokenised assets. Two dates decide whether the rally holds.
January 20, 2025 12:23 AM

Crypto News: Bitcoin Flash Crash, Trump Token Dumps, and Exchanges are Down?
The crypto market is in turmoil today, with Bitcoin suffering a sharp flash crash, Trump Token facing unexpected wallet dumps, and Melania’s new meme coin launch adding fuel to the fire.
December 5, 2024 11:00 PM

BGB Price Prediction: Bitget Token Price UP by more than 25%
Bitget is a top crypto exchange, with its native token BGB surging over 24% in the last 24 hours. Learn why Bitget stands out, what BGB offers, and how you can get started.
October 24, 2024 6:59 PM
GOAT Meme Coin Skyrockets 680% in 1 Month: Here's how Truth Terminal Helped Boost Prices
The rise of Goatseus Maximum (GOAT) has taken the crypto world by storm. How did Truth Terminal become the first AI crypto millionaire?
May 5, 2025 8:00 AM

Meme Coins Defy Market Downturn: May 2025 Outlook and Q2 Forecast
Find out which meme coins are defying the crypto downturn in May 2025, with fresh momentum, political hype, and what price predictions are shaping their Q2 forecasts.
September 21, 2026 7:20 PM

Morpho Stands Out: 33 Percent Below Its High
Morpho gains about 12 percent. A different number is more striking: the token sits only 33 percent below its all-time high, while the day's other winners stand 80 to 90 percent below theirs. What lies behind it.
May 20, 2024 10:19 AM

Will Dogwifhat (WIF) Price Still Go Up To Reach $5?
Dogwifhat (WIF), a meme coin based on a viral Shiba Inu meme, is making headlines with its skyrocketing value. What price to expect and what are the support levels now?

October 12, 2021 7:33 PM

Why Traders Should Buy The Wojak Token
The Wojak token recently made a 2500% jump in the market. Find out in this article if you can still buy the token despite the jump.
March 31, 2025 10:57 AM
Top 3 Reasons Why NOW Is a Good Time to Buy Cryptos
Crypto prices have dropped over 20% in the past month, but smart investors see this as an opportunity. Here’s why now is the perfect time to buy cryptos before the next surge!
March 17, 2025 6:00 AM

MANTRA OM Price Prediction for March 2025: Will OM Price Reach $50?
MANTRA OM price surges despite the downtrends, making OM token rank as the top-performing crypto of 2025. But what about the MANTRA OM price prediction for March 2025? Will this momentum continue for OM price to reach $50?
November 10, 2025 7:08 PM

Top 5 Cryptos Soaring as U.S. Government Shutdown Ends
As the U.S. government shutdown ends, the crypto market is rallying. Here are the top 5 coins leading the surge — with gains up to 68%.
December 26, 2024 1:08 PM

BGB News: Bitget Token Reaches New ATH Amid Market Momentum
Bitget Token (BGB) defies the market downtrend, hitting a new ATH of $7.32. What's driving this 368% surge and what the future holds for this top-performing cryptocurrency?
October 21, 2024 12:57 PM

MEW Price Prediction After Reaching A New ATH
MEW Token (Cat in a Dogs World) reached a new all-time high today, driven by recent price spikes and strong technical indicators. Could it break through resistance and set another new ATH?
April 19, 2026 10:29 AM

RAVE Token Crash 95% in $6 Billion Wipeout: Insider Scam or Trader’s Paradise?
RAVE plummets 95% as allegations of insider manipulation surface. While retail investors suffer, professional traders eye a "Dead Cat Bounce" opportunity.
April 27, 2026 6:00 AM
3 Cryptocurrencies to Watch This Week
Three specific assets dominated the charts this week. Here is why these market leaders might face high volatility and price adjustments in the coming days.

April 18, 2026 1:36 PM
Top 5 Crypto Losers in 2026: Why These Altcoins Are Crashing
5 cryptocurrencies are currently heavy in the red for 2026. We analyze the YTD losses of Midnight, Sei, Aptos, and more in this market update.
January 22, 2025 7:31 PM

Tornado Cash OFAC Sanctions Overturned: A Huge Win for Crypto Privacy and a 150% TORN Price Surge
The U.S. court’s reversal of Tornado Cash OFAC sanctions marks a pivotal moment for blockchain privacy, sparking a dramatic surge in the TORN price.
January 20, 2025 1:50 PM

Ethereum Price Prediction with Vitalik Buterin New Leadership after ETH Price Struggles in Bitcoin's Shadow
ETH price struggles with Bitcoin’s dominance, Trump’s crypto moves, and the Solana blockchain surge. As Vitalik Buterin announces leadership changes to reshape Ethereum’s future, what to expect for Ethereum price and blockchain?
March 23, 2025 1:08 PM

XRP vs ADA in 2025: Which Crypto Will Lead the Next Bull Run?
ADA and XRP are both making headlines in 2025 with big price moves and bullish predictions. Which crypto will lead the next bull run?
September 21, 2026 7:25 PM

Litecoin Has an ETF, and Almost Nobody Uses It
Litecoin gains 11.5 percent. A spot ETF has traded on the Nasdaq since October 2025; at the end of June it held around $5.49 million. What that gap says about ETF expectations.
September 21, 2026 4:29 PM

Render Jumps 19 Percent: What Really Drives The AI Tokens
Render gains around 19 percent, placing it directly behind Sui. The whole group of AI cryptocurrencies is rising as a block. Three network metrics show why capital is landing here.
May 18, 2026 1:07 PM
Is Solana a Good Buy in 2026? SOL Price Analysis and Potential ROI
Solana (SOL) trades at $119.48 after clearing the $100 resistance. Here's how SOL's potential returns stack up against BTC, ETH, and XRP.
April 24, 2026 6:33 PM
Top 5 Cryptos to Buy in April 2026: Strong Recoveries After Ceasefire?
Discover the best cryptocurrencies to buy in April 2026 as markets prepare for a relief rally following Middle East tensions and significant price corrections.
June 10, 2025 12:17 PM

Hyperliquid Hits New ATH Today: What's the Hype about HYPE?
Hyperliquid (HYPE) just hit a new all-time high, and traders are piling in. But what's fueling this rally, and is it sustainable? We break down everything from whale activity to tokenomics.
More from CryptoTicker