
Ethereum Price Prediction: Can ETH Blast Toward $2,750 Next?
Ethereum price prediction after a 30% August rally: ETH sits at $2,453 with RSI cooling. Here are the bullish and bearish ETH price targets.





Which topics should we dive deeper into?
Select what genuinely interests you. Your picks feed directly into our editorial planning.
Crypto news that's actually worth your time.
Weekly. 60 seconds. Carefully curated by our editors: no hype, no promo flood, no spam.
Ethereum spent most of 2026 as the market's punching bag. Then, in the space of six trading sessions, it went from forgotten altcoin to the best performing major asset in crypto. ETH is trading at $2,453.79 as of August 30, and the question every trader is now asking is simple: was that the start of something, or just a very expensive short squeeze?
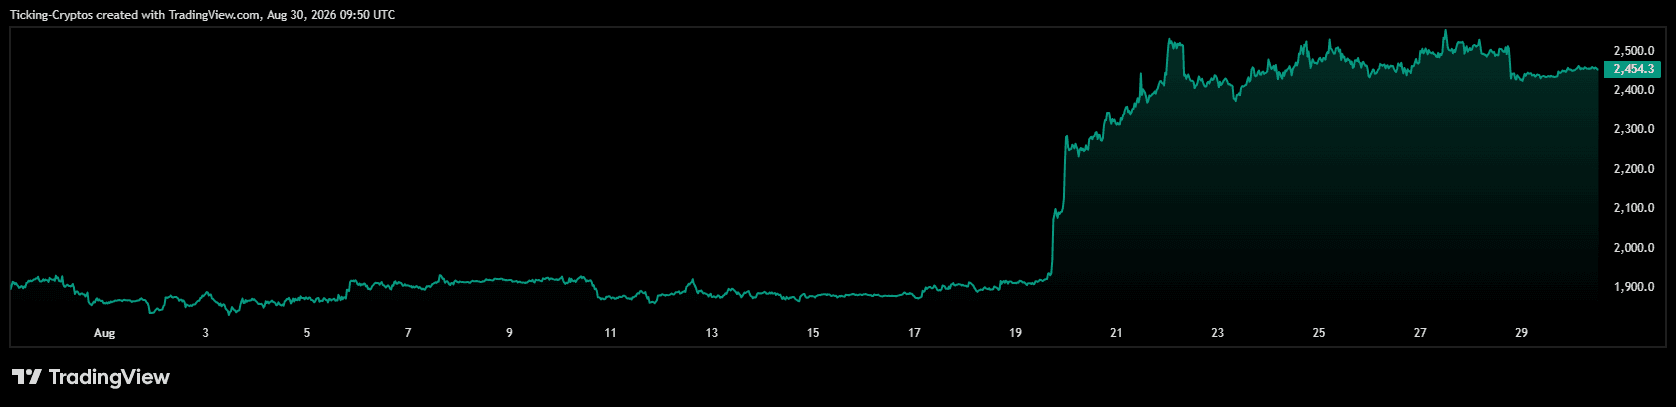
Here is the full Ethereum price analysis, what drove the move, what the chart says right now, and where the realistic bullish and bearish ETH price targets sit.
What happened to the Ethereum price in 2026 so far?
To understand the current setup, you need the wreckage that came before it.
$Ethereum opened June at roughly $1,988 and then fell apart, crashing to a low near $1,512 and closing the month around $1,558. That is a drawdown of about 22% in a single month, driven by a combination of Ethereum Foundation restructuring uncertainty and persistent ETF outflows. At that point $ETH was down more than 65% from its all time high of roughly $4,953 set in August 2025.
July brought a slow, grinding recovery. ETH clawed back to around $1,760 by early July and $1,953 by the end of the month. Through the first half of August it did almost nothing, holding just below $1,950 in a tight range that had been capping price for weeks.
Then came August 19.


Why did the Ethereum price explode in August 2026?
Three things stacked on top of each other in the same week, and that is why the move was so violent.
1. A macro catalyst. On August 19 the US Treasury announced it would at least double the maximum size of its buybacks of longer dated government bonds, from around $2 billion to at least $4 billion per operation for 10 to 30 year securities, starting September 9. Long term yields fell on the news, financial conditions loosened, and risk assets caught a bid.
2. A brutal short squeeze. Months of ETH underperformance had built up a mountain of bearish positioning, and the Treasury headline detonated it. ETH jumped roughly 20% in a single session on August 19, its largest one day gain since May 2025. Short liquidations hit approximately $265 million in 24 hours and around $1.69 billion over three days. In one 24 hour window, $237 million in shorts were wiped out against just $65 million in longs.
3. Real institutional money, not just forced buying. This is the part that separates this rally from a standard squeeze. US spot Ethereum ETFs pulled in $697.2 million in net inflows across the five sessions through August 21, their strongest week of 2026 and their best showing since early October 2025. And it did not stop there. BlackRock's iShares Ethereum Trust (ETHA) attracted roughly $1.02 billion across nine consecutive sessions from August 17 to August 27 with zero days of net selling, capturing about 72% of all US spot Ethereum ETF inflows in that window. The broader category added another $102.1 million on August 28.
Squeezes fade. Nine straight days of ETF accumulation is a different signal entirely.
What does the Ethereum chart say right now?
Looking at the ETHUSD daily chart, here is the current technical picture.
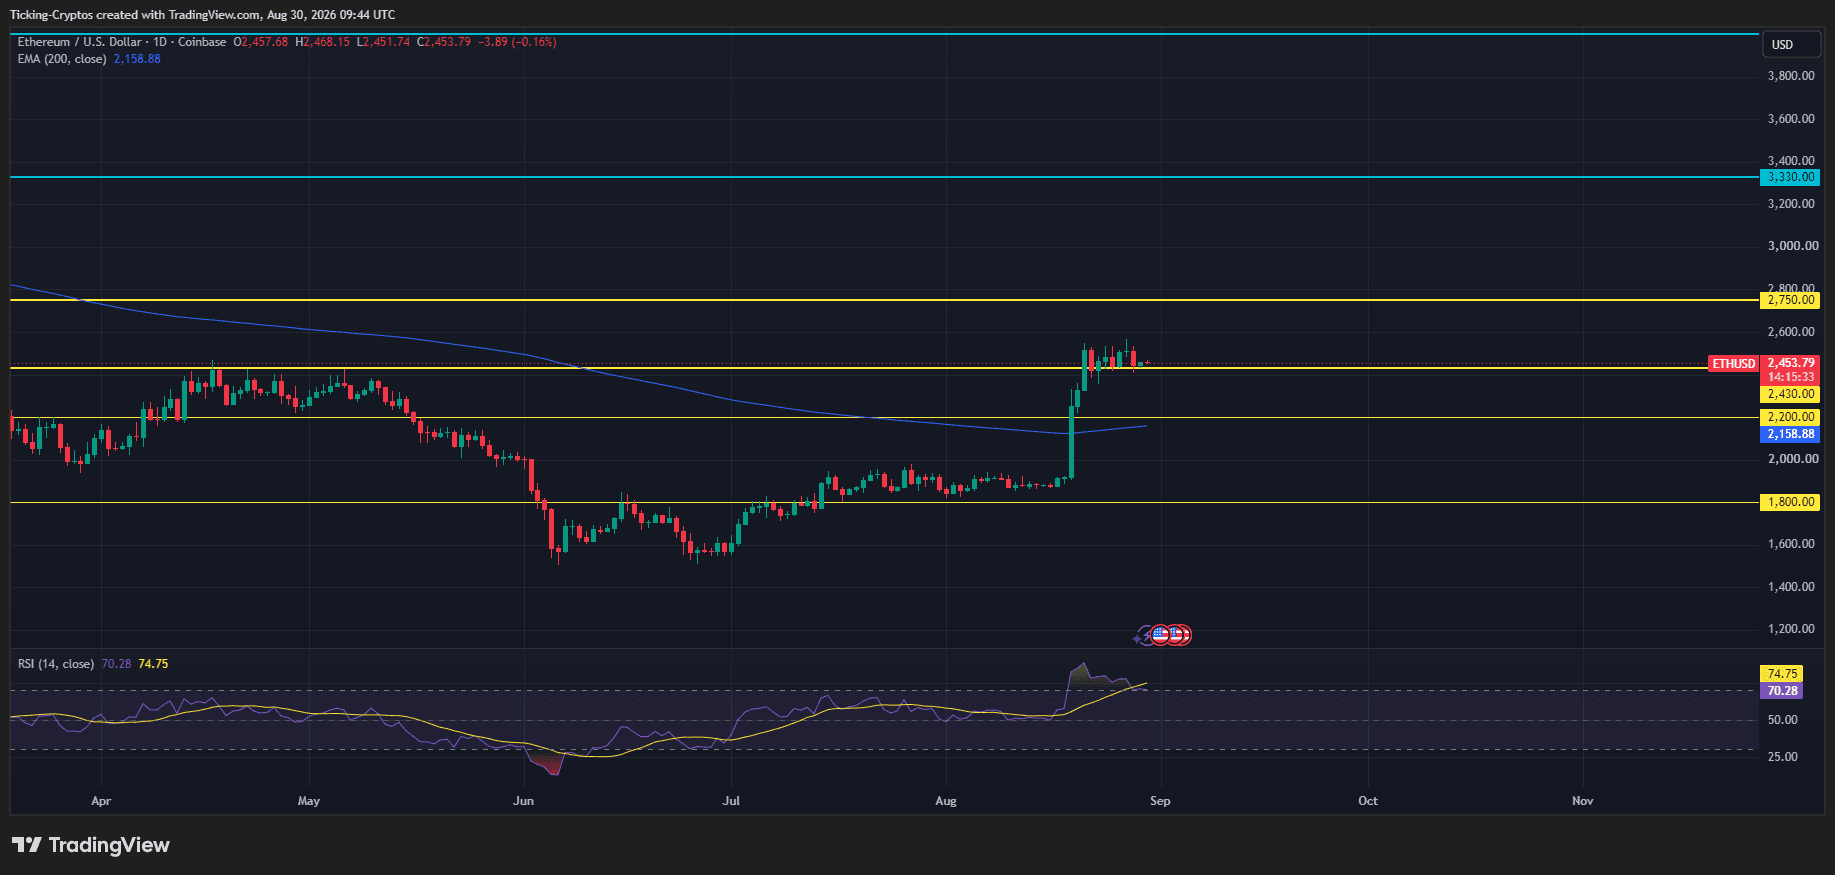
- Price: $2,453.79, essentially flat on the day at -0.16%, with the session ranging between $2,451.74 and $2,468.15. ETH ran from roughly $1,900 to a local high near $2,550, and it has now been chopping sideways just below the highs for about a week.
- The 200 EMA is the big one. The 200 period exponential moving average sits at $2,158.88, and price is now well above it after months of rejection. That blue line spent April through August acting as a ceiling. It is now a floor. That flip is the single most important structural change on this chart.
- RSI is cooling off, which is healthy. The daily RSI reads 70.28, down from readings in the high 70s and low 80s during the peak of the breakout. That is still technically overbought, but the fact that RSI is bleeding lower while price holds sideways is textbook time based consolidation. Momentum is resetting without a price collapse. That is what you want to see after a vertical move.
The levels that matter:
- $2,430 is immediate support and the line ETH is currently sitting on. This was resistance through April and May. It needs to hold.
- $2,200 is the next major support, and it lines up closely with the 200 EMA zone at $2,158.
- $1,800 is the last line of defence, the level that capped the July recovery.
- $2,750 is the first significant overhead resistance, the supply zone that capped price back in May.
- $3,330 is the big structural target sitting well above current price.
Volume tells a supporting story. The breakout sessions printed the heaviest turnover since the June selloff, which is exactly what was missing during the four failed attempts to clear the moving averages earlier in the summer.

What is the latest Ethereum news? Glamsterdam explained
The biggest fundamental story around Ethereum right now is not the price, it is the Glamsterdam hard fork, the network's most significant protocol change since The Merge.
Glamsterdam combines the Gloas consensus layer upgrade with the Amsterdam execution layer upgrade, and both must activate together. It is built around two headliner proposals:
- EIP-7732 (Enshrined Proposer-Builder Separation) moves block building on chain and is projected to cut MEV extraction by up to 70%.
- EIP-7928 (Block-Level Access Lists) enables parallel transaction processing, with a target of pushing the gas limit from around 60 million toward 200 million and throughput toward 10,000 transactions per second.
- A gas repricing package (EIP-7904) is projected to cut Layer 1 fees by roughly 78.6%.
The timeline has slipped repeatedly. Glamsterdam was originally targeted for the first half of 2026, then Q3, and developers have now pushed the mainnet target to Q4 2026. The Ethereum Foundation launched a dedicated public testnet called Platåberget on August 13, running around 50,000 validators across roughly 50 nodes, with the Glamsterdam fork activating on that testnet on August 20 before it moves to Sepolia and Hoodi.
There is a warning attached. The Foundation's Protocol DevOps team has said that wallets, indexers and gas estimation tools that assume a hardcoded maximum gas limit or a single gas dimension will break after the upgrade. EIP-8037 introduces a separate state gas dimension, meaning transfers to new accounts will cost more than the flat 21,000 gas that developers have assumed for a decade. Regular ETH holders need to do nothing, but stakers and node operators must update both consensus and execution layer clients before activation.
For price, the read is straightforward: a delayed upgrade removes a near term catalyst, but a successfully shipped Glamsterdam in Q4 with 78% lower fees would be the strongest fundamental narrative Ethereum has had in years.
What are the bullish Ethereum price targets?
The bull case runs like this. ETH has reclaimed every major moving average on the daily chart, the 50 EMA has crossed above the 100 EMA, ETF demand is running at the highest sustained pace since October 2025, and staking plus ETF absorption is steadily shrinking the liquid float.
Bullish ETH price targets:
- $2,550 to $2,600. The immediate ceiling and the local high from the breakout. A daily close above this range is the first confirmation that supply near $2,500 has been absorbed rather than sold into.
- $2,750. The May supply zone marked on the chart, and the logical first real target if $2,600 gives way. Several analysts have flagged the $2,700 to $2,800 region as the natural extension of this move.
- $3,000. A widely watched psychological level. Market commentators have argued a weekly close above the $2,500 to $2,550 zone opens a direct path here.
- $3,330. The upper structural target on the chart. This is not a September story. It would require ETF inflows to continue through Q4 and Glamsterdam to ship cleanly, but it is the level that defines the next range if the breakout matures into a trend.
For September specifically, forecasts cluster around a $2,450 to $2,950 band with a $2,800 central target, conditional on ETH clearing $2,500 and consolidating above it while the overbought reading unwinds.

What are the bearish Ethereum price targets?
Now the other side, because the risks here are real and they are not small.
Positioning is crowded. Retail traders are heavily long, with reports of roughly 70% long positioning on major venues, while top traders sit closer to 57% long. That gap between the crowd and larger accounts is a classic setup for a flush. Futures open interest ballooned to around $31.8 billion during the rally, and rising open interest into an extended move means leverage risk is stacking, not clearing.
There is also the honest structural point: a meaningful share of this rally was forced short covering. Once bearish positions are cleared, that buying pressure disappears. Squeezes historically revert.
Bearish ETH price targets:
- $2,430. Losing this on a daily close is the first crack. It flips the current consolidation from a base into a lower high.
- $2,300 to $2,350. The breakout zone. If price cannot hold here, the August move starts looking like an overshoot rather than a trend change.
- $2,200 and the 200 EMA at $2,158. This is the line that decides everything. A sustained break back below the 200 EMA invalidates the entire breakout thesis and puts ETH back inside the range it spent all summer trapped in.
- $1,800. Worst case. Only relevant if ETF flows reverse hard and the broader macro bid disappears.
Macro is a wildcard too. Firmer US inflation data has revived talk of tighter Fed policy, and speculative assets like ETH are the first to feel that pressure.
What should Ethereum traders watch next?
Three things, in order of importance.
- ETF flows. The moment BlackRock's ETHA streak posts a session of net redemptions, the strongest pillar under this rally weakens. Sustained inflows through September would carry far more weight than one strong week tied to a macro headline.
- The first real pullback. Watch the volume on the way down. Light volume on a dip means profit taking inside an uptrend. Heavy selling into a decline means distribution near $2,500 and a very different picture.
- The $2,430 to $2,550 box. ETH is coiled between support and resistance. Whichever side breaks on strong volume sets the direction for September.
Ethereum remains roughly 50% below its August 2025 all time high near $4,953. That is either the bear case or the opportunity, depending on how much you believe the institutional bid is real.
Frequently asked questions about the Ethereum rally and Glamsterdam
Related articles
Which topics should we dive deeper into?
Select what genuinely interests you. Your picks feed directly into our editorial planning.
Crypto news that's actually worth your time.
Weekly. 60 seconds. Carefully curated by our editors: no hype, no promo flood, no spam.

April 6, 2026 6:24 PM

Ethereum Price Analysis: ETH Consolidates Between $1,800 and $2,100, What’s Next?
Ethereum price is stuck in a tight range between $1,800 and $2,100. Analysts warn of a decisive breakout or breakdown as volatility reaches a boiling point.

April 19, 2026 6:34 PM

Ethereum Price Analysis: Key Levels Holding, Will ETH Crash or Bounce Toward $2,500?
Ethereum tests critical support near $2,330. Will ETH bounce toward $2,500 or break lower? Full price analysis and targets.
September 14, 2026 4:55 PM

Ethereum Price Hit $2,600 Then Stalled: Here Is What Decides the Next Move
Ethereum price tapped $2,600 for the first time since January, then faded. The Fed, the 200 EMA and a wall of ETH supply now decide the next leg.
July 27, 2026 10:57 AM
Ethereum Price Analysis: ETH Rips 30%, Is $2,000 Next?
Ethereum just printed a 55-day high of $1,980 and is up 30% in 30 days. Here is what the 3H chart says about $2,000 and the targets beyond it.
September 18, 2026 4:41 PM

Solana Price Prediction: Why SOL Is Setting Up for $120
Solana just tagged $110 and the 200 EMA is rising. Here is what the SOL chart says about $120 and what has to hold first.
August 29, 2026 10:30 AM
XRP Price Prediction: XRP Ripped From $1 To $1.66 In Three Days, Here Is Where It Goes Next
XRP exploded 66% off the $1 floor, then gave back a third of it. Here is the full chart breakdown and the XRP price targets that matter now.
March 23, 2026 10:41 AM

SOL Price Prediction: Key Levels to Watch in late March 2026
Solana (SOL) battles $90 resistance as institutional ETF inflows hit $1.45B. Explore key support levels and the impact of the Alpenglow upgrade on SOL price.
August 8, 2025 1:20 PM

Ethereum Price Prediction: Can BlackRock’s $103M Buy Push ETH to $4,000?
Ethereum is trading just below $3,900 after BlackRock reportedly bought $103 million worth of ETH. Could this institutional move be the spark that sends ETH to $4,000?
June 12, 2024 2:17 PM

Ethereum (ETH) Price Prediction For BULLISH And BEARISH Scenarios
The latest analysis of Ethereum's price movements as of June 12, is divided between the 2 scenarios: bullish and bearish. But what drives each, and which is more likely to occur?
February 18, 2026 6:53 AM

Ethereum Price Prediction: Will the $2,000 Support Hold or Is a Deeper Correction Looming?
Ethereum price struggles to maintain the $2,000 psychological level. Analyze the latest ETH coin news and price predictions for 2026 amid market consolidation.
August 10, 2025 11:00 PM

Ethereum Price Prediction: Can the OKX Giveaway Boost ETH Price to a New ATH?
Ethereum trades above key support with bullish momentum. Could OKX’s latest giveaway help push ETH toward a new all-time high?
July 11, 2024 5:00 PM

Cardano Price Analysis: Potential 10% Surge and Massive Whale Inflows
Cardano (ADA) shows potential for a 10% price rally and sees a massive 1,218% surge in whale inflows. Here are the technical analysis and whale activity driving ADA's bullish momentum.
June 20, 2026 11:51 AM

Solana (SOL) Price Prediction: Can SOL Reclaim $76 and Target $90 — or Is $60 Back in Play?
Solana trades near $71 after bouncing off $60. We analyze the SOL/USD chart, key support and resistance, and the targets that matter next.
November 17, 2025 8:55 PM

BREAKING: Ethereum Price Crashes Below $3,000 as Bitcoin Triggers Market Meltdown
Ethereum drops under $3,000 after Bitcoin’s fall below 92K. Chart signals deeper weakness as key support levels fail.
March 30, 2025 2:12 PM

Ethereum Price Prediction March 2025: Can ETH Price Surge Back Over $3K?
Ethereum price predictions for March 2025 with the latest Ethereum news can be highly controversial. Check the Ethereum price analysis, the factors influencing ETH price, and the multiple Ethereum price predictions.
June 30, 2024 7:29 PM

DOGE Price Prediction for July 2024: What to Expect?
What lies ahead for DOGE in July 2024? Here is a brief analysis as we are about to end June and enter into July, along with predictions for DOGE's price movement and market trends.
August 28, 2024 6:12 PM

Breaking News: Will This Volatile Summer End With Bullish Signs For Bitcoin Price?
Bitcoin price summer volatility continues! Will it break out or fall further? Get expert analysis, key levels to watch, and industry leader predictions.
March 8, 2026 10:06 AM

Ethereum Price Prediction: ETH Is Preparing for a Breakout From This Ascending Channel Formation
Ethereum trades near $1,960 inside an ascending channel formation. A breakout could push ETH toward $2,200 if key support holds.
June 5, 2024 5:03 PM

Crypto Market Up: Bitcoin Breaches $71K, Altcoins Follow Suit, Eyes on New Highs
Cryptocurrencies are experiencing a surge, with Bitcoin leading the charge by surpassing $71,000. This bullish trend extends to altcoins, igniting optimism across the market. Will Bitcoin reach new highs?
August 24, 2026 12:22 PM

Ethereum Price Prediction: Is $3,000 the Next ETH Target?
ETH ripped 29% and reclaimed the 200 EMA. Our Ethereum price prediction explains the path to $3,000 and the one level that kills the bull case.
April 26, 2026 3:14 PM

Will Ethereum Coin Break its $4,900 ATH in 2026?
Ethereum eyes a potential return to its $4,900 ATH in 2026. Discover the technical hurdles and institutional catalysts driving the current ETH price action.
May 16, 2026 2:22 PM

Ethereum Price Analysis as ETH risks Crashing below the $2,000 Support
Ethereum struggles to stay above key support levels. Technical charts and rising exchange inflows indicate that ETH could drop below $2,000 soon.
March 26, 2025 7:01 PM

Can Dogecoin Price Hit $1 and Be the Surprise Winner of 2025?
DOGE price is climbing fast—could Dogecoin hit $1 in 2025? Here are the latest price analyses, bullish signals, and the key role of Elon Musk and X Payments in DOGE’s next moonshot.
July 8, 2024 7:51 AM

Crypto Market Crash News As BTC Price Crash Back To 56K
With the crypto market crash, and Bitcoin price drop to below 56k with recent dormant BTC whales activity, what comes next: a correction or further crash soon?
August 13, 2025 8:40 AM

Ethereum Price Hits New High at $4,678 – $5K SOON as BlackRock Buys $318.7M in ETH...
Ethereum reached a new high of $4,678, edging closer to its 2021 record. With BlackRock purchasing $318.7M worth of ETH, the $5K milestone may be next.
May 20, 2024 12:08 PM

Ethereum (ETH) Up To $4000: Can ETH Break Out From The 3K Levels?
With 2 days until the SEC's decision on spot Ethereum ETFs, ETH price surges above the 3.1K and hints about new all-time-highs are on the horizon. Could ETH break out of the current levels and go back to around 4K as back in early March of this year?
April 18, 2025 1:05 PM

Massive BTC & ETH Options Expiry Today – What It Means for the Market
Over $2.25 billion in Bitcoin and Ethereum options are expiring today, sending ripples across the crypto market. With traders eyeing the “max pain” levels, could we see sudden price swings in BTC and ETH?
More from CryptoTicker