
Solana Crash Below $100 Triggers Massive Long Liquidations
As of February 4, 2026, Solana (SOL) has decisively broken below the psychological $100 support level, marking its lowest price point in nearly a year.





Which topics should we dive deeper into?
Select what genuinely interests you. Your picks feed directly into our editorial planning.
Crypto news that's actually worth your time.
Weekly. 60 seconds. Carefully curated by our editors: no hype, no promo flood, no spam.
Solana Price Analysis: The Anatomy of a Crash
The current price action os $Solana reveals a stark technical shift: what was once a rock-solid floor has now become a formidable ceiling.
- The Breakdown: After failing to sustain momentum near the $118–$120 supply zone in late January, SOL entered a freefall. The 2-hour chart shows the price currently fighting to stabilize near $95.72 after dipping as low as $93.38.
- Negative Funding Trap: Market sentiment is currently at an extreme. Data shows the OI-weighted funding rate has turned negative (roughly -0.0057%), meaning short-sellers are so aggressive they are actually paying long-holders to keep their bearish bets open.
- Oversold Signals: On the 2-hour timeframe, the Stochastic RSI is buried at 6.38, deep in oversold territory. While this suggests the selling pressure is reaching a point of exhaustion, any relief bounce will face immediate and heavy resistance at the $100.30 and $106.53 levels.
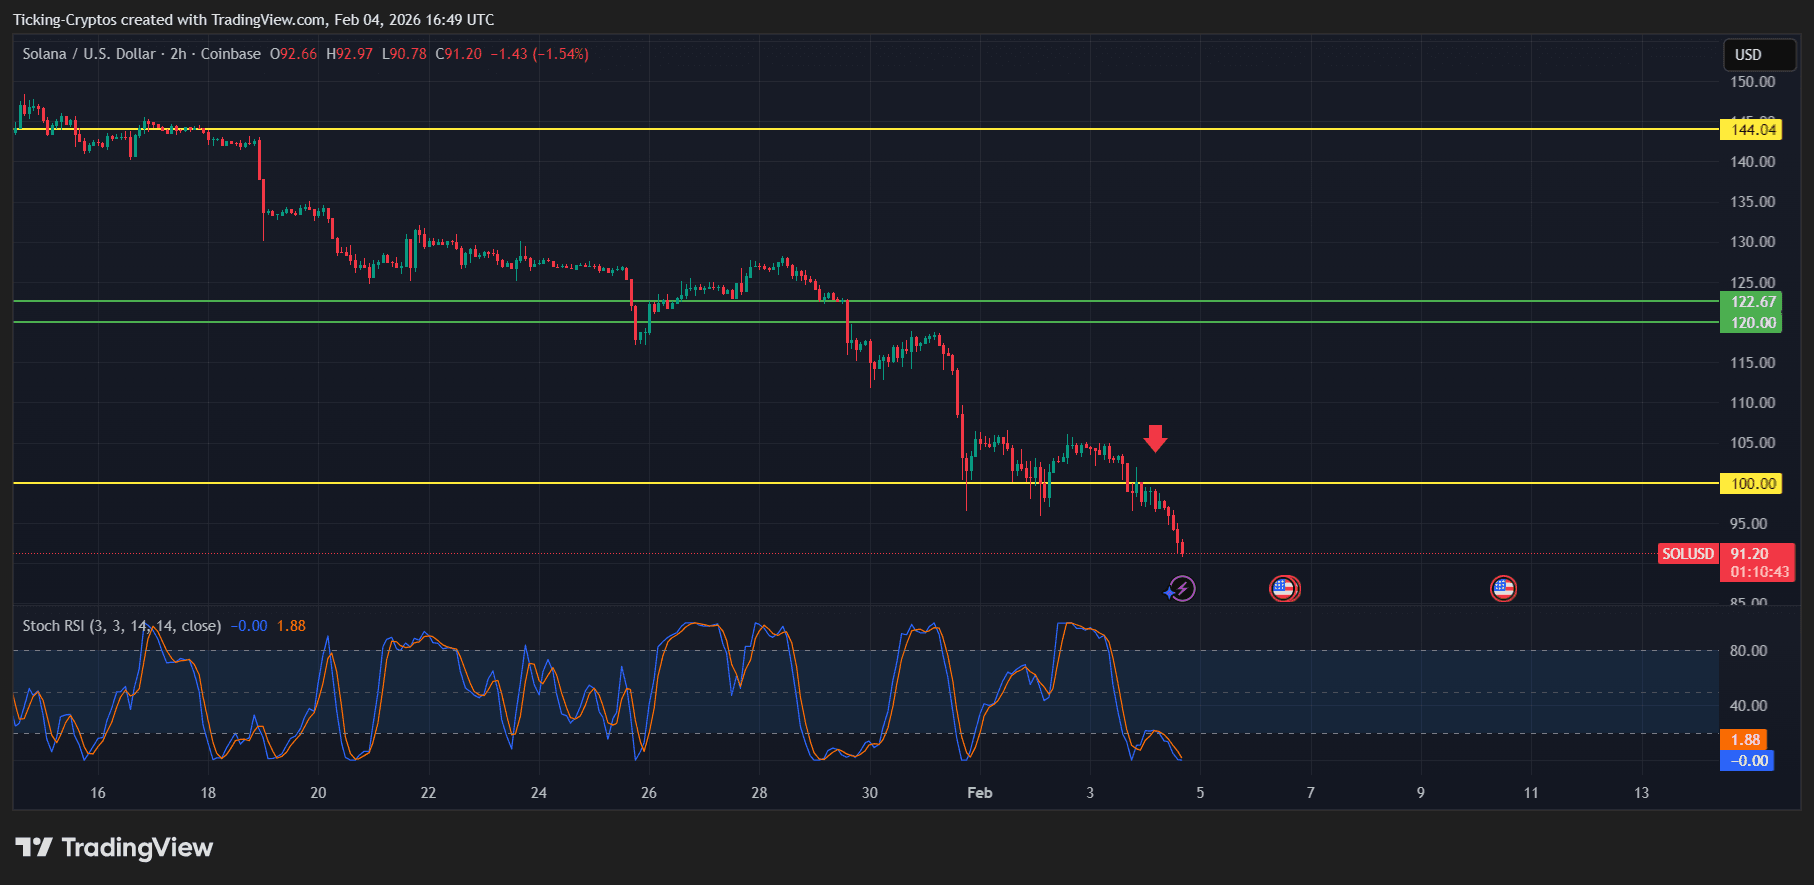
Why did Solaba Crash below $100
This crash isn't happening in a vacuum; it’s the result of a "perfect storm" of macro and ecosystem factors:
- Macro "Risk-Off" Sentiment: Broader markets are under heavy pressure, with Bitcoin sliding toward $75,000. The Crypto Fear & Greed Index has plunged to 14 ("Extreme Fear"), dragging high-beta assets like SOL down faster than the market average.
- ETF Outflows: For the first time since their high-profile launch, Solana spot ETFs recorded weekly net outflows of $2.45 million, signaling that institutional "smart money" is moving to the sidelines.
- Leverage Flush: The breach of $100 acted as a "tripwire." Of the total liquidations, nearly $24.7 million were long positions, creating a sell-side feedback loop that accelerated the drop to $93.
- On-Chain Divergence: Ironically, network usage is surging. Solana is currently processing over 3,700 TPS with a TVL of $9.3 billion. However, the market is currently ignoring these fundamentals in favor of liquidating over-leveraged traders.
Solana Price Prediction: Where Does the Slide Stop?
With $SOL struggling to maintain its footing in the mid-90s, the market is looking for a macro bottom.
Downside Targets (Bearish)
- Immediate Support: $90.00 - $92.00. This is the primary weekly demand zone. If this fails to hold on a daily close, the "crash" narrative will likely intensify.
- Macro Floor: $78.93. This represents the January 2024 trough. Analysts warn that a failure at $90 opens the door for a 20% slide to this final line of defense.
Upside Targets (Recovery)
- Target 1: $106.53. Reclaiming this level (the 20-day EMA) is the first step to proving the crash was a "bear trap."
- Target 2: $122.67. A break above this resistance would be required to declare the trend officially reversed.
Related articles
- Zcash Crash: ZEC Coin Falls 40% After AI Bug Scare — Here Are the Next Supports
- Ethereum Price Prediction 2026: Technical Analysis of ETH Coin During the Crypto Crash
- Solana Price Crash: Why Is Solana Price Crashing Hard?
- Ethereum Price Crash: What Next Support Levels For ETH Price Below $3K?
- Crypto Crash Reasons: Why Bitcoin Just Plunged Below $63k
Which topics should we dive deeper into?
Select what genuinely interests you. Your picks feed directly into our editorial planning.
Crypto news that's actually worth your time.
Weekly. 60 seconds. Carefully curated by our editors: no hype, no promo flood, no spam.

March 27, 2026 4:45 PM

Iran-Israel War Escalation: Why the Crypto Market is Crashing Today
Why are cryptos crashing? Reports of intensified missile exchanges between the United States, Israel, and Iran have affected cryptos. Here's the crypto news today.
June 4, 2026 4:30 PM

Zcash Crash: Why Is ZEC Falling Harder Than the Rest of the Crypto Market?
Zcash price crashes harder than major cryptos as ZEC faces profit-taking, technical uncertainty, and renewed pressure after its recent rally.
May 23, 2026 5:28 PM

Crypto Market Crash Deepens as Bitcoin Breaks Below $75K
Crypto market crash deepens as Bitcoin falls below $75K, Ethereum nears $2K, and altcoins slide amid liquidations and macro fears.
March 27, 2026 9:54 PM

Will Solana Crash to $70? Key Levels Investors Must Watch Right Now
Will Solana drop to $70? Key support levels, macro risks, and market signals reveal whether SOL is heading for another major correction.
May 16, 2026 10:50 AM

Crypto Crash: Bitcoin Slips to 78k as Market Reverses Friday Pump
Crypto prices face a sharp downturn after a brief Friday pump. Bitcoin hovers at 78k, threatening a deeper crash if macro support breaks.
July 8, 2024 7:51 AM

Crypto Market Crash News As BTC Price Crash Back To 56K
With the crypto market crash, and Bitcoin price drop to below 56k with recent dormant BTC whales activity, what comes next: a correction or further crash soon?

February 5, 2026 7:37 PM

XRP Price Crash: Will Ripple Coin reach $1.00 ?
XRP price has plummeted to $1.20 amid a massive crypto market sell-off. Analysts now eye the $1.00 psychological support as the next target.
January 30, 2026 10:12 AM

Crypto Crash Reason: Why is Bitcoin Crashing Today and Key Supports
The crypto market is facing a sharp correction. What are the crypto crash reasons today, and what are Bitcoin support levels, and how are macro factors hitting prices?
September 29, 2026 10:38 AM

Bitcoin Falls Toward $83,000 as Trump Rejects Iran Ceasefire Deal
Bitcoin slipped toward $83,000 after Trump rejected Iran's Hormuz proposal, sending oil above $100 and wiping out $478 million in crypto liquidations.
July 5, 2024 11:16 AM

Bitcoin News Today: Bitcoin Price Crash BELOW 50K?
Bitcoin's crash has sent shockwaves through the cryptocurrency market. With a significant price drop of over 5% in just 24 hours, is the bottom yet to come for Bitcoin price?
May 16, 2026 2:22 PM

Ethereum Price Analysis as ETH risks Crashing below the $2,000 Support
Ethereum struggles to stay above key support levels. Technical charts and rising exchange inflows indicate that ETH could drop below $2,000 soon.
December 10, 2024 12:30 AM

Bitcoin Price Drops Below $100K – Is a Bigger Crash Coming?
Bitcoin has fallen below $100K, triggering a broader market correction of over 8% in the last 24 hours. With profit-taking and large sell-offs hitting the market, could Bitcoin drop to $90K or lower?
March 30, 2025 1:11 PM

Solana News: Solana Price Might Bring a Rebound After a Harsh March
Solana Price Prediction: March was a rough ride for Solana, with a sharp correction and a dip below $130. But as April begins, there are signs of a possible turnaround.
June 1, 2026 6:20 PM

Why is Bitcoin Crashing? BTC Hits $71K Despite Massive Michael Saylor Purchase
Bitcoin price tumbled sharply to $71,239, risking a drop below $70,000 despite massive institutional accumulation from Michael Saylor's Strategy.
May 13, 2026 6:52 PM

Why Did Bitcoin Price Crash below 80k Today?
The crypto market is in turmoil as Bitcoin and Ethereum lose critical support levels. What triggered the sudden price collapse?
March 27, 2026 9:45 PM

Bitcoin Price Crash: Why BTC Fell Below $68,000 Today
Bitcoin price faces a sharp slump below $68,000 as a $14 billion options expiry and Middle East geopolitical tensions trigger a wave of liquidations.
February 25, 2025 12:18 AM

XRP Price Prediction as Cryptos Crash: Will XRP Price Reach $1?
XRP price prediction: Ripple price is in freefall as the crypto market crashes — how low can it go? Will XRP price reach $1?
June 25, 2024 6:26 PM

Solana Price Prediction: Will SOL Surpass 200$?
Why Solana, Shiba Inu, and Cardano are poised for a major rebound, according to the latest market analysis. Can Solana capitalize on the buy signals and reach a new price target?
November 19, 2025 6:00 PM

BREAKING: XRP Holds $2 as Bitcoin Crashes Below $90K, But Can the Support Survive?
XRP is fighting to stay above $2 while Bitcoin slides under $90K. Charts show risk of a deeper drop toward $1.80 and possibly $1.70 next.
November 3, 2025 10:20 AM

Why did Bitcoin Crash Below $108K? Here are Apparent Reasons...
Bitcoin falls below $108K as a major insider sells 12,500 BTC, sparking market fear and speculation over whether the next stop is $100K.
June 15, 2024 3:00 PM

Bitcoin Price Prediction in June 2024: Why is Bitcoin Price Down?
Bitcoin's recent plunge from its psychological price of $70,000 to $66,250 has triggered widespread concern in the cryptocurrency market. Why is Bitcoin price down?
April 12, 2024 9:44 PM
XRP Tumbles More Than 11%! What's Behind the XRP Decline?
XRP has taken a significant hit, succumbing to the aftershocks of Bitcoin's recent failure to breach the $70,000 mark.
April 2, 2026 2:44 PM

Bitcoin Price Drops Below $66,000 as $251M in Longs Vanish
Bitcoin slumps below the $66,000 mark, triggering over $251 million in liquidations. Technical analysis reveals a bearish trend line and key support levels.
October 22, 2024 3:01 PM

POPCAT Price Prediction: Is The CAT About To POP A New ATH
Is the CAT about to POP a new ATH? The answer is the full picture of the POPCAT price surge with these inputs: the POPCAT price analysis and the POPCAT price prediction, leading to the new POPCAT ATH potential.
December 4, 2025 7:45 AM

Ethereum Price Explodes Back Above $3,200: Bigger Moves Coming?
Ethereum jumps back above $3,200 as Bitcoin reclaims $90K. Fresh U.S. liquidity signals and strong risk-asset demand now set the tone for ETH in December.


More from CryptoTicker