
Is Shiba Inu a Good Buy at Current Prices?
Shiba Inu now trades above both its 50-day and its 200-day average. What the chart, RSI, volume and supply mechanics mean for an entry. What speaks for buying at the current price — and what against it.





Which topics should we dive deeper into?
Select what genuinely interests you. Your picks feed directly into our editorial planning.
Crypto news that's actually worth your time.
Weekly. 60 seconds. Carefully curated by our editors: no hype, no promo flood, no spam.
Shiba Inu trades at roughly 0.00000569 US dollars on 3 October 2026. That leaves the price 55.8 per cent below its twelve-month high of 0.00001288 US dollars, and 38.4 per cent above its twelve-month low of 0.00000411 US dollars. Anyone buying today is buying the largest meme coin behind Dogecoin after a recovery off that low that has now carried it back above its 200-day average. Is that an entry price or a trap?
cryptoticker.io compiled these price data itself on 3 October 2026. The source is market data from CoinGecko, and the calculations use daily closing prices from the past 365 days up to and including 2 October 2026. The moving averages, the RSI and the distances to the high and the low come from standard formulas applied to that data set, so every figure in this article can be checked against the same source.
Shiba Inu price analysis: where the SHIB price stands today
The Shiba Inu price stands at 0.00000569 US dollars, down 4.0 per cent over seven days and down 0.6 per cent against the last daily close of 0.00000573 US dollars. At that level the token carries a market capitalisation of about 3.35 billion US dollars; its rank by market value is not stated here, because the figure was not retrievable at the time of collection.
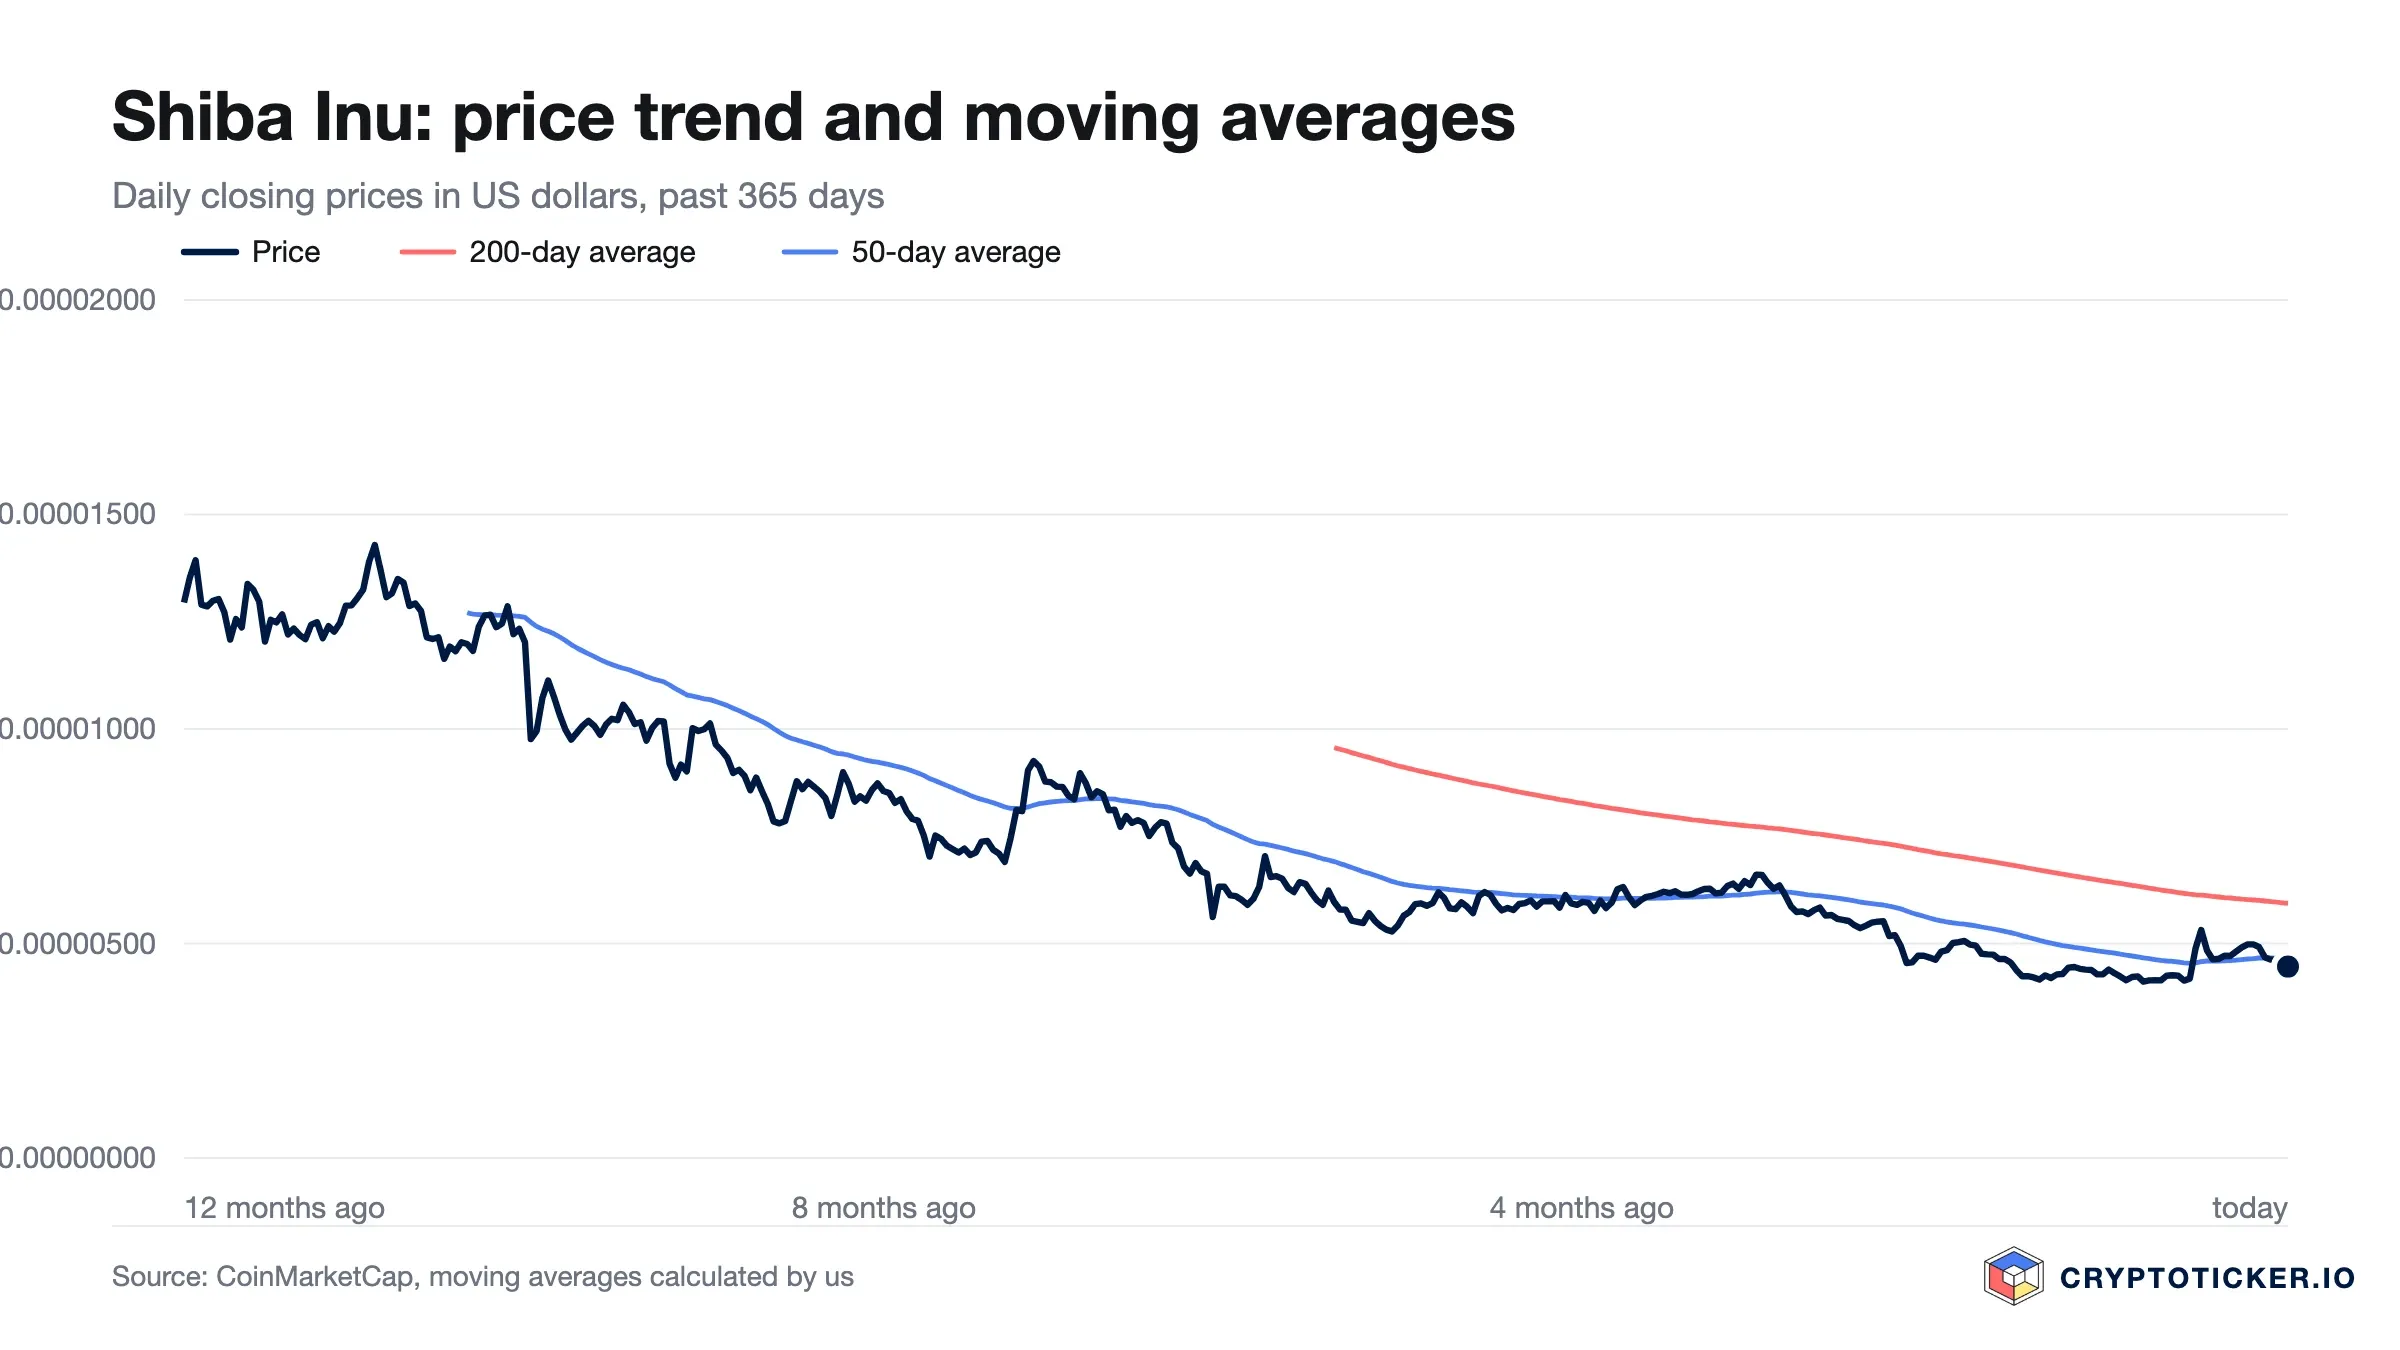
Three marks frame the current picture. The twelve-month low of 0.00000411 US dollars, set on 17 July 2026, now sits 27.8 per cent below the market. The 50-day average of 0.00000538 US dollars runs 5.7 per cent below the price, which reclaimed it during the September advance. The 200-day average of 0.00000565 US dollars now also runs below the market, by a slim 0.7 per cent.
The market has left the zone between the 50-day line and the 200-day line and now sits above both, which makes the gap between those two averages the reference for anyone judging whether the base built since July turns into a trend change or stalls.
Is the Shiba Inu downtrend broken or only interrupted?
Over twelve months the Shiba Inu price has fallen 55.1 per cent, from 0.00001267 US dollars in October 2025 to today's level. Over 90 days, however, the price is up 29.0 per cent. The 30-day window shows a gain of 5.3 per cent. The quarterly recovery therefore sits inside a decline that remains intact over a year, and it has extended its ground over the past month.
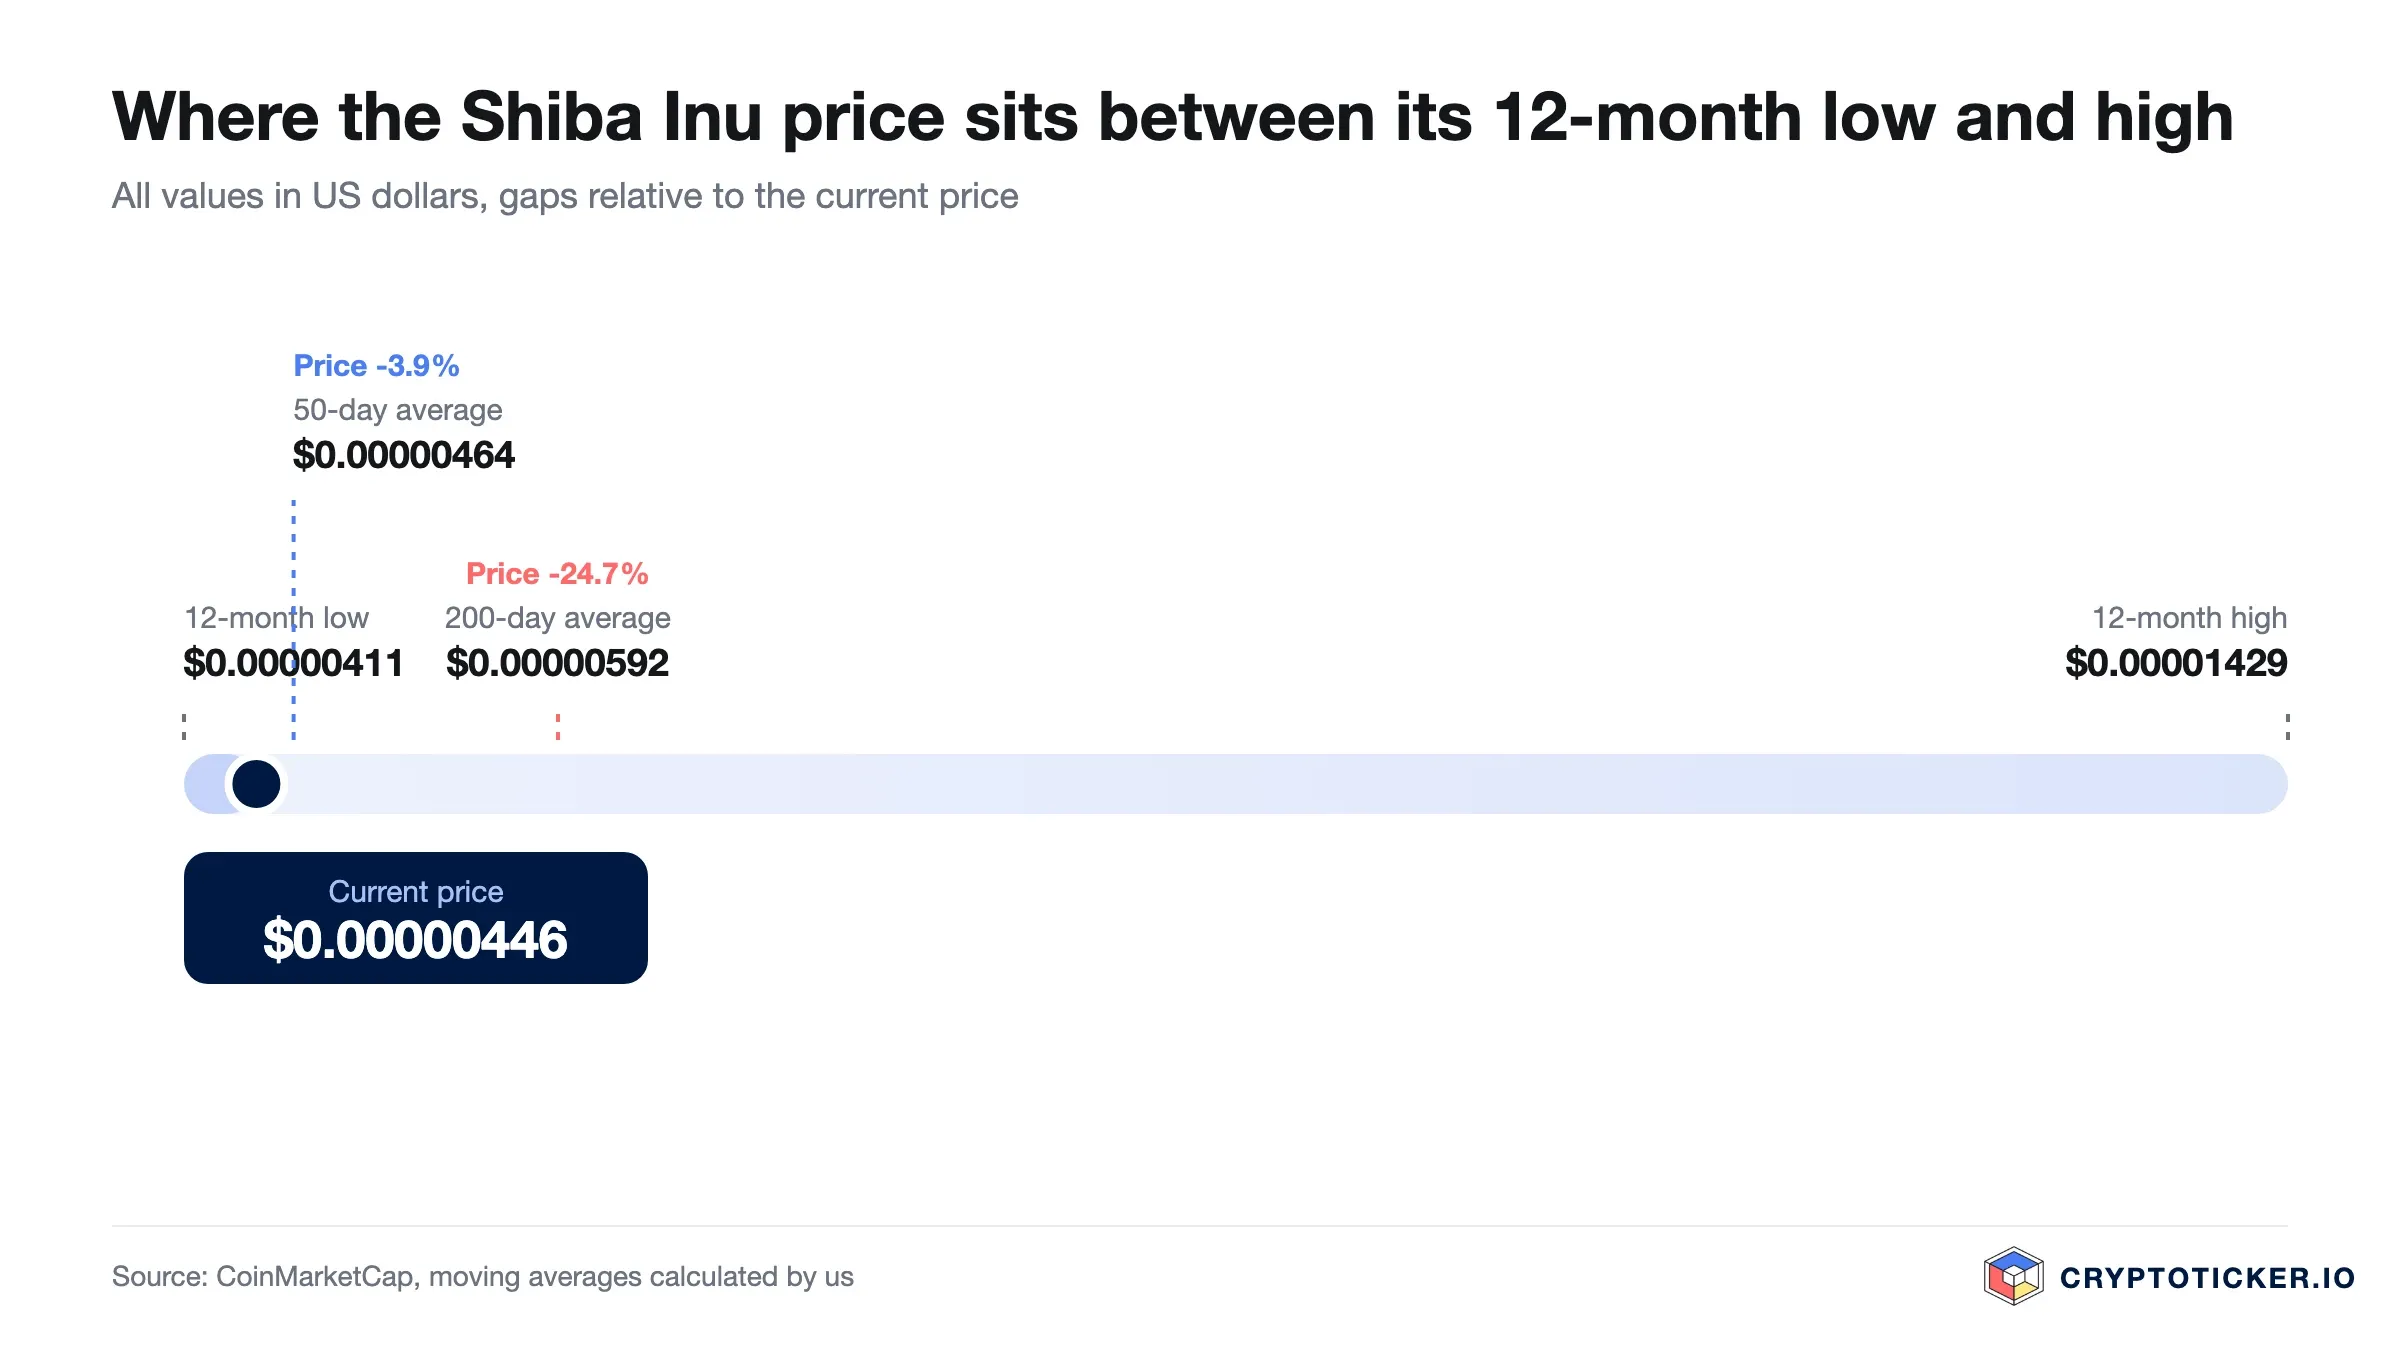
The relationship between the two averages says the same thing more precisely. The 50-day line at 0.00000538 US dollars still trades 4.7 per cent below the 200-day line at 0.00000565 US dollars, although the price now sits above both. That is a downtrend that has not yet been fully broken. The first of the two conditions for a trend change, reclaiming both averages, is met; the shorter line crossing above the longer one is not.
What has changed is the direction of the short horizons. The steep phase of the decline ran between May and July 2026; since then the market has recovered 29.0 per cent over the quarter while easing 4.0 per cent in the past week. Such phases can precede a base as easily as a continuation, and the data available today do not settle which.
What RSI and moving averages mean for a Shiba Inu entry
The 14-day RSI stands at 53.5, above the neutral midpoint of 50 and well below the overbought threshold of 70. For a buyer this is the least helpful reading the indicator can produce, because it signals neither an exhausted sell-off nor an overheated advance.
The distance to the averages is more informative. At 5.7 per cent above the 50-day line the price has taken that level comfortably, which gives the recovery a technical footing. The 0.7 per cent cushion above the 200-day line is the fragile part, since averages of that length tend to be tested repeatedly for months after a decline of this size.
For an entry decision the two figures pull in opposite directions. The short average now offers a near, testable support against which a position can be measured, while the long average marks the level the market must now defend before the twelve-month trend could be called repaired. Position sizing should reflect the second number.

What trading volume reveals about demand for Shiba Inu
Shiba Inu turned over about 105.8 million US dollars in the past 24 hours. Measured against a market capitalisation of 3.35 billion US dollars, that is a turnover ratio of 3.2 per cent, which is unremarkable for a token of this size and indicates neither panic selling nor a rush of new buyers.
The trend behind that figure carries more weight. Average daily volume was around 95 million US dollars over 30 days, around 92 million over 90 days, and around 123 million across the full twelve months. Current activity therefore runs above the monthly average but still below the annual one.
Thin volume has a practical consequence. Order books are shallower, spreads widen faster in stress, and a position that looks modest on screen can move the market when it is sold. The advance into October arrived with turnover only modestly above the monthly average, which is a weak confirmation of demand.
Structural factors that speak for Shiba Inu: supply, usage, regulation
The supply mechanics are the clearest structural argument. Of a maximum supply of about 589.55 trillion tokens, roughly 589.24 trillion are already in circulation. Nearly the entire supply is therefore on the market, and Shiba Inu carries almost no unlock overhang of the kind that weighs on tokens whose team and investor allocations vest over years.
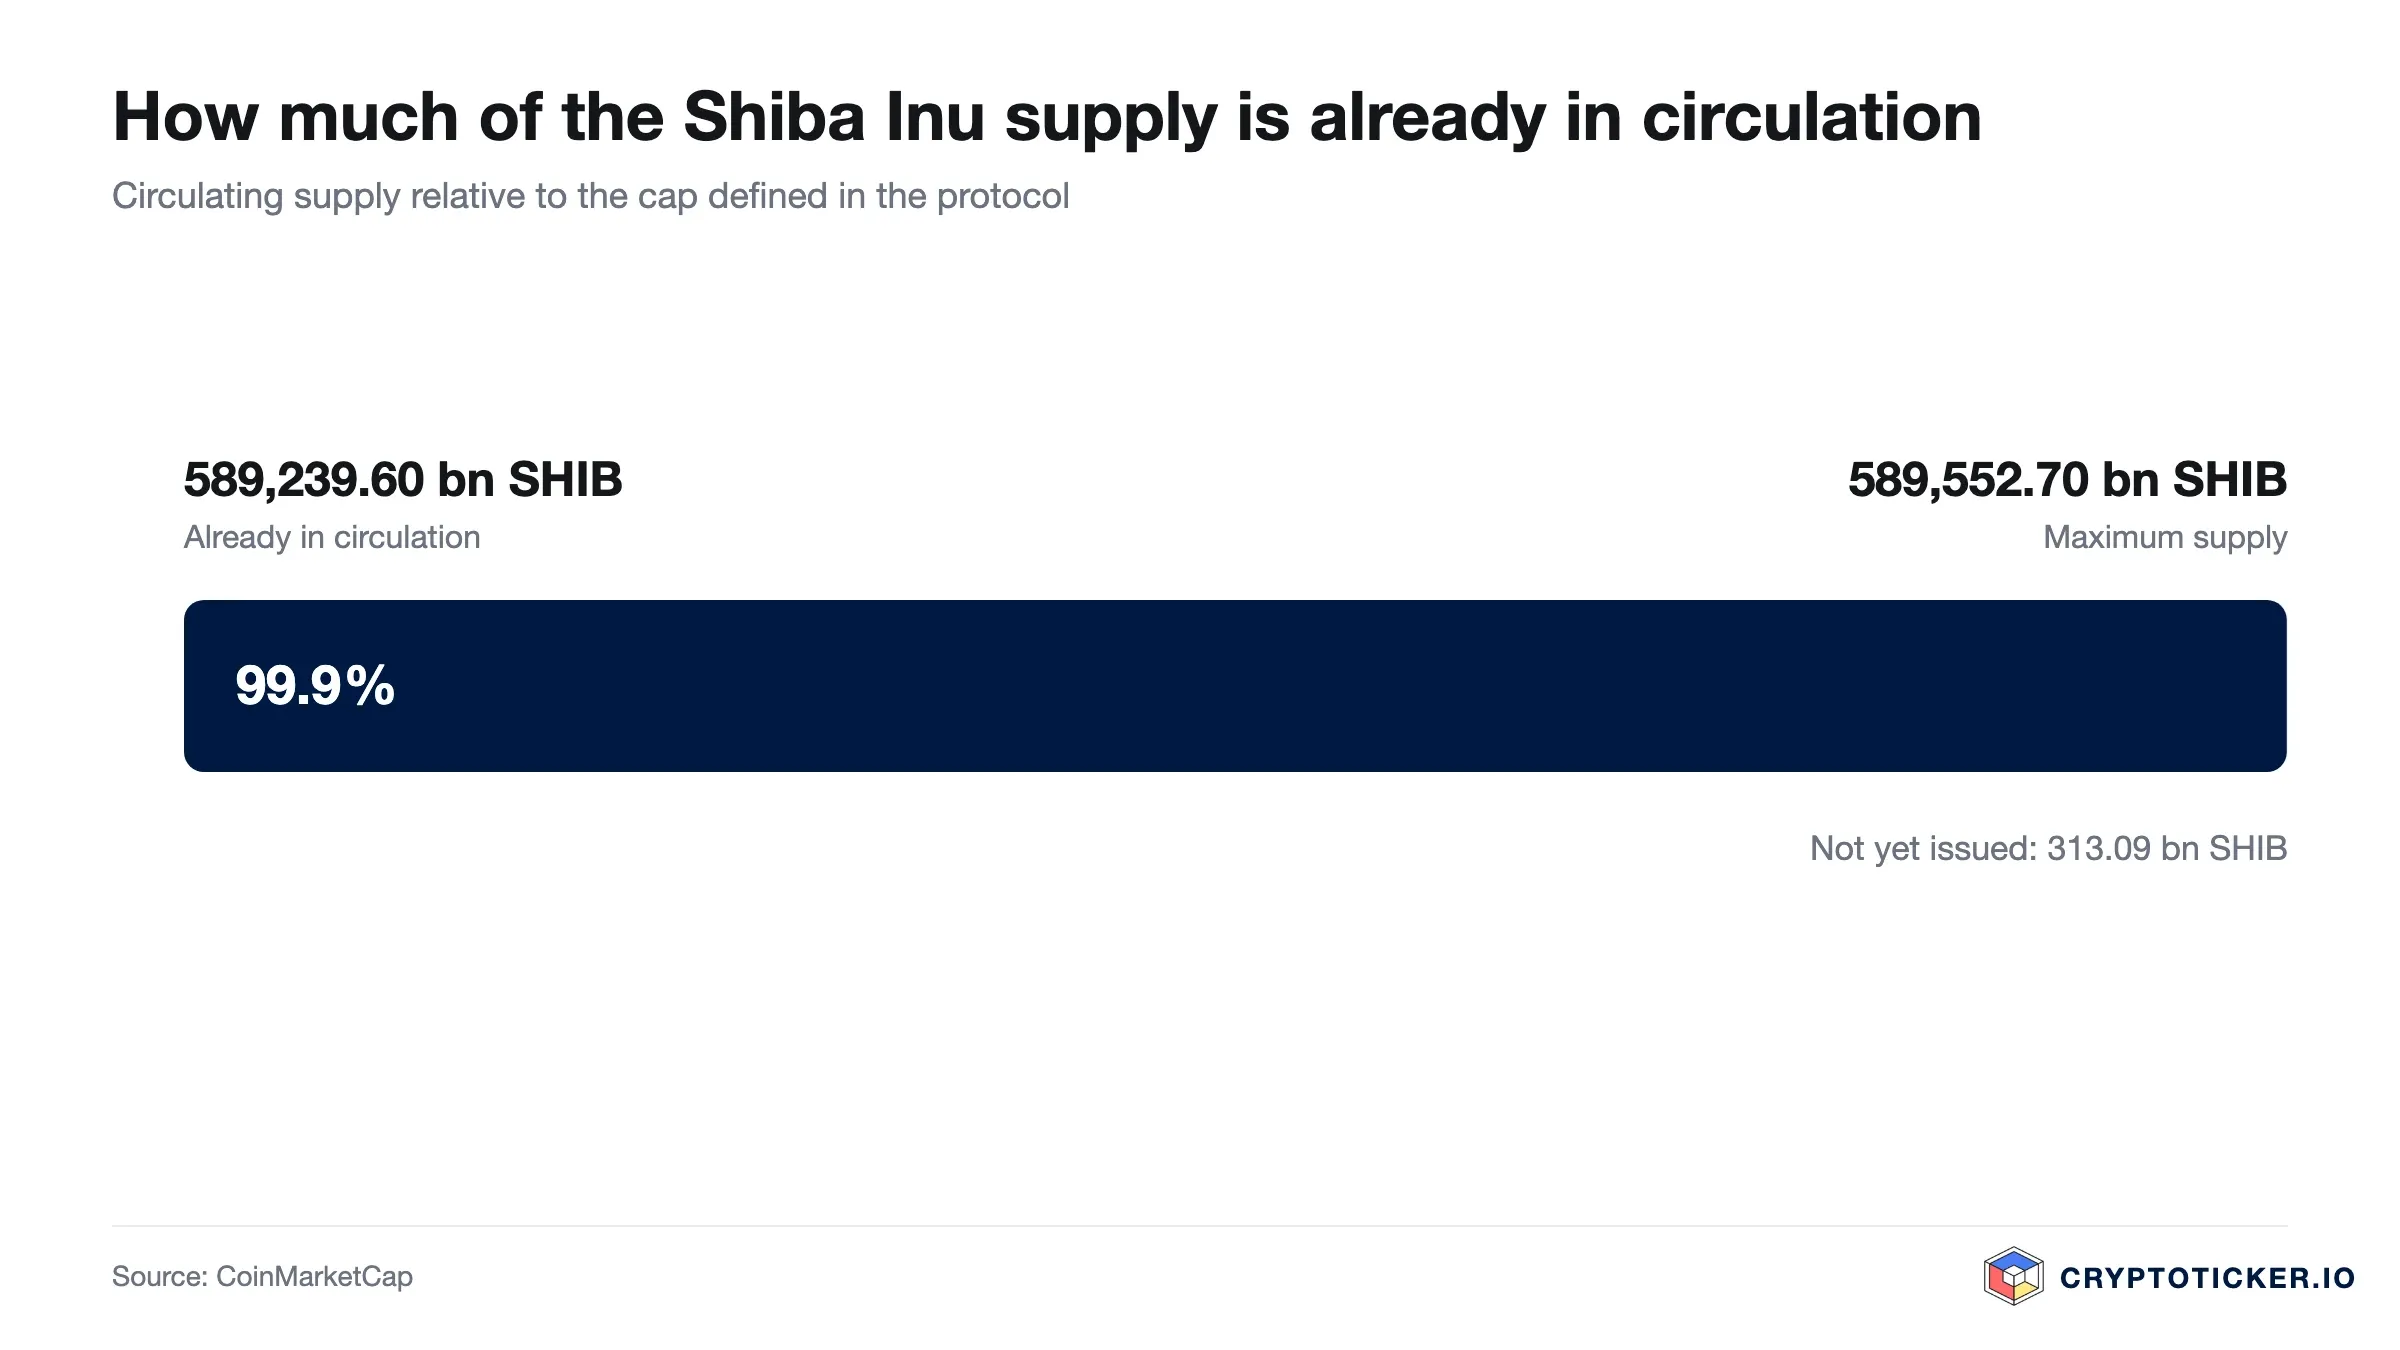
Against that stands the scale of the float. A supply measured in hundreds of trillions keeps the price per token in the millionths, and any narrative built on the token reaching a round number such as one cent implies a market capitalisation far beyond anything the asset class has produced. The project's burn mechanism removes tokens from circulation, but the rate observed to date is small relative to the total.
On usage, Shiba Inu is an ERC-20 token settling on Ethereum, which ties its transaction costs and throughput to Ethereum's development path as set out in the Ethereum roadmap. The project also operates its own layer-2 network, Shibarium, intended to move activity off the main chain. How much sustained economic activity that network carries is the open question for any long-term thesis.
Regulation cuts both ways. Within the European Union, trading venues fall under the MiCA framework supervised alongside national authorities by the European Securities and Markets Authority, which has raised disclosure and custody standards for platforms serving retail clients. That improves the conditions under which a token is traded, and says nothing about the merits of the token itself.
 FOMO FamilySponsored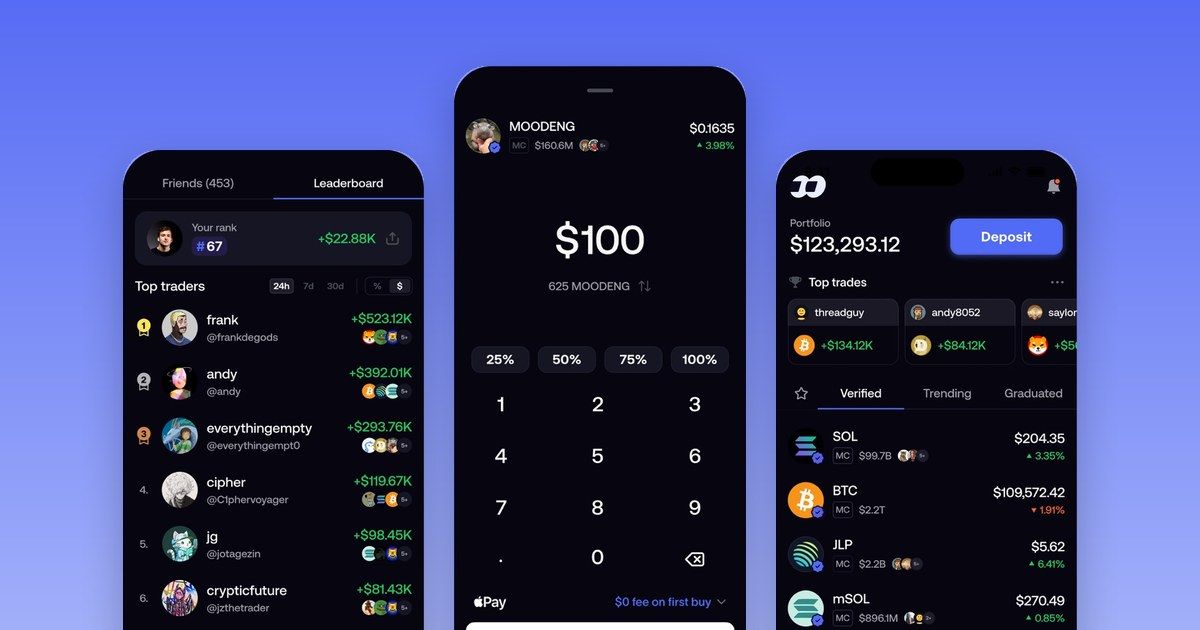
Buy meme tokens straight from your phone
We used FOMO Family ourselves and bought meme tokens with it, Robinhood Chain included. Deposit, find the token, buy: it takes seconds. Our link gets you ten percent off the fees.
Get the app and 10% off fees →Memecoins are high risk, a total loss is possible. Partner link.
What speaks for buying Shiba Inu at current prices
Three arguments carry weight at 0.00000569 US dollars.
The price has cleared a tested level. The twelve-month low of 0.00000411 US dollars has held since July and now lies 27.8 per cent below the market, while the reclaimed 50-day average at 0.00000538 US dollars gives a nearer reference point against which the position can be judged.
The supply picture is unusually clean. With almost the entire maximum supply already circulating, future dilution from scheduled unlocks is close to irrelevant. Price moves are driven by demand rather than by new tokens arriving on the market, which removes one variable that burdens many comparable assets.
Liquidity remains adequate. A market capitalisation above 3 billion US dollars and daily turnover above 100 million mean the token can be bought and sold on regulated venues without the execution problems typical of smaller meme coins. That matters most at the point of exit.
What speaks against buying Shiba Inu at current prices
Three arguments point the other way, and they are the stronger set.
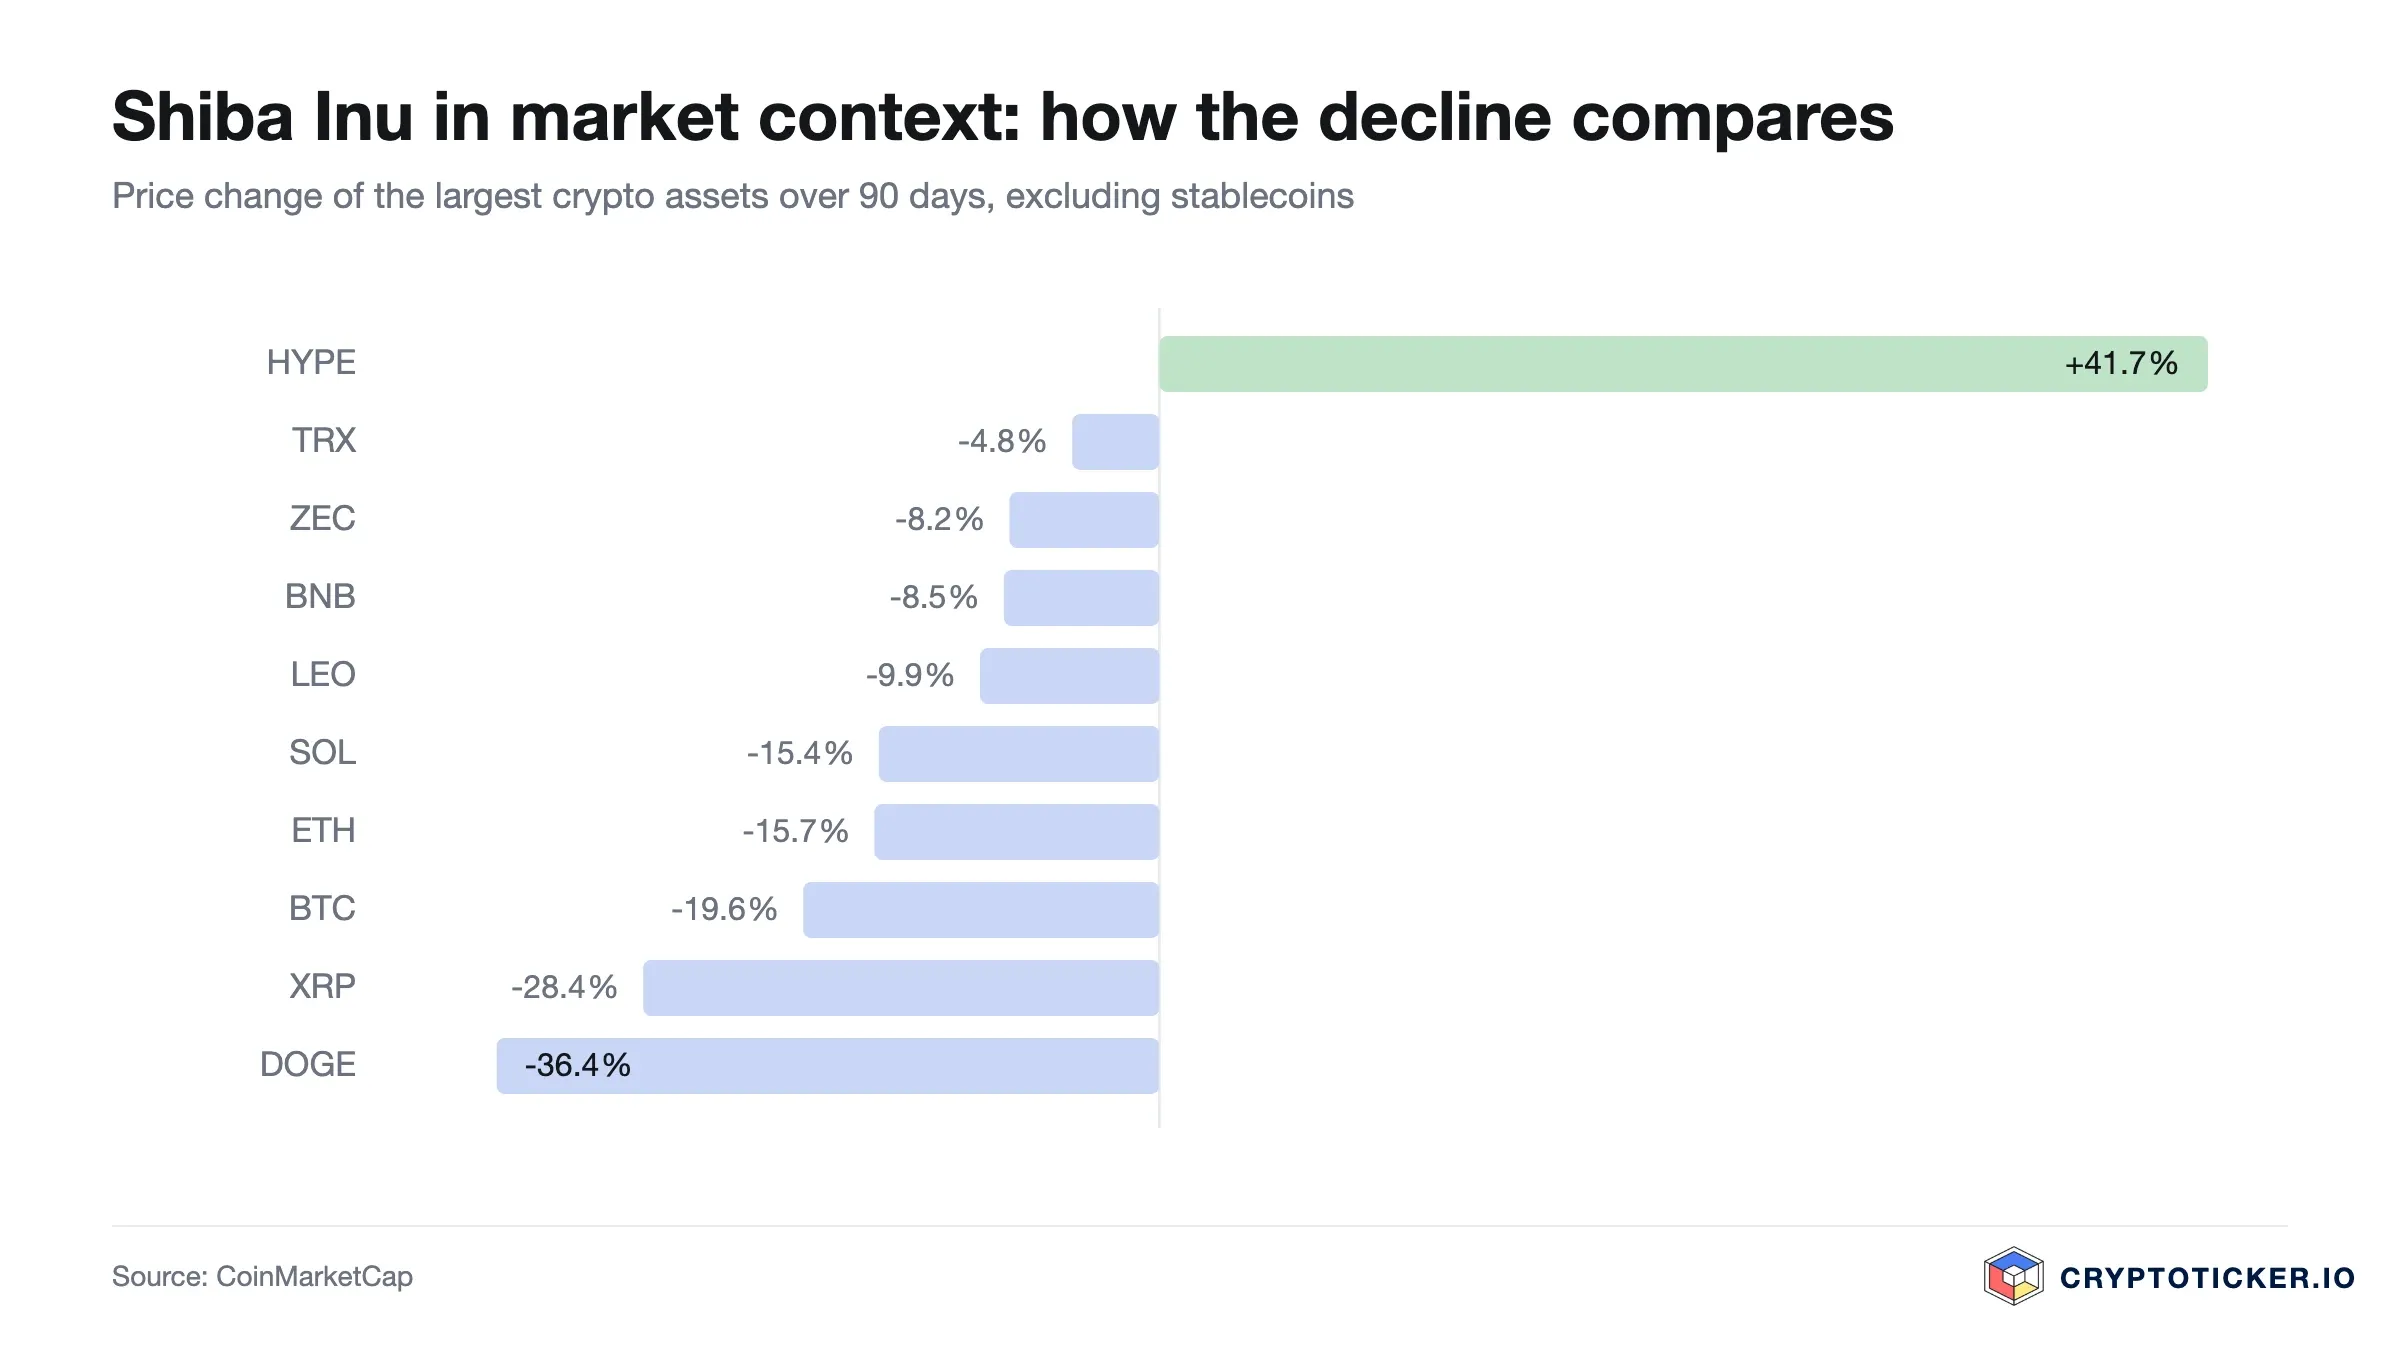
The longer trend is not yet repaired. The price trades only 0.7 per cent above the 200-day average of 0.00000565 US dollars, the 50-day average still sits 4.7 per cent below the 200-day line, and the twelve-month loss is 55.1 per cent. Buying here means buying a breakout that a single weak week could undo.
Demand is not building at the pace of the price. Daily volume of 105.8 million US dollars against a twelve-month average of 123 million, combined with a price that has eased over the past week, describes a market that has not regained its participants. Recoveries built on thin volume have a poor record of holding.
The valuation rests on attention. Shiba Inu has no cash flow, no fee claim accruing to holders, and no supply schedule that forces scarcity. What remains is demand driven by sentiment, and turnover around a tenth below the annual average shows how little of that demand is currently present. Assets of this type tend to fall hardest when sentiment deteriorates further.

How to buy Shiba Inu at current prices
Shiba Inu is listed on most large exchanges, so the practical questions are cost, custody and the standing of the venue. Fees differ more than headline rates suggest, because the spread applied at execution often exceeds the stated commission. Our exchange comparison sets the cost components side by side.
For buyers inside the European Union, the supervisory status of the venue is worth checking before the fee schedule. Platforms authorised under the current framework face disclosure and asset-segregation requirements that unregulated venues do not, and our overview of regulated exchanges shows which providers hold the relevant permissions. For a single provider, our Bitpanda review covers costs, deposit methods and account requirements.
Custody is the decision that follows the purchase. Tokens left on an exchange remain subject to that platform's solvency and security, which is acceptable for a short holding period and less so for a multi-year one. Anyone holding Shiba Inu for longer should compare the options in our hardware wallet comparison and account for the one-off cost of the device, which for a position sized in the low hundreds of euros can exceed any plausible saving on trading fees.
So is Shiba Inu a good buy at current prices?
Over the short term the evidence has turned, without becoming compelling. The price now trades above both averages, the RSI at 53.5 gives no entry signal, and volume remains below the annual average. The constructive element is the 200-day average at 0.00000565 US dollars, which has changed from resistance into the level the market has to hold. A short-term case would require that level to survive several daily closes on rising turnover, and that condition is not yet settled.
Over the long term the question turns on something the chart cannot answer. The supply structure is clean and liquidity is sufficient, which removes two common objections. What remains open is whether Shibarium develops sustained economic activity, since without it the token's value rests on the durability of attention. Our Shiba Inu price prediction tracks that picture.
Two scenarios frame the outcome. In the constructive one, the 200-day line at 0.00000565 US dollars holds as support, volume returns above its twelve-month average, and the 50-day line closes the remaining 4.7 per cent gap from below. In the adverse one, the market falls back below 0.00000538 US dollars on rising volume, at which point the recovery since July has stalled and the assumption of a base is refuted. That second condition is the clearest test available, and it belongs in writing before a position is opened.
Buying Shiba Inu: what to take away
- The trend has turned, but only just. At 0.00000569 US dollars the price sits 0.7 per cent above the 200-day average and 5.7 per cent above the 50-day average, with a twelve-month loss of 55.1 per cent. Anyone buying is buying into a trend repair that still has to prove itself, and our Shiba Inu price prediction follows the levels that would have to change first.
- The 200-day average is the reference point. It lies at 0.00000565 US dollars, and the twelve-month low of 0.00000411 US dollars now sits 27.8 per cent below the market. Execution costs matter at these levels, and our exchange comparison shows where the spread does the damage.
- Custody belongs in the plan from the start. A position held beyond a few weeks does not belong on an exchange indefinitely, and the options are set out in our hardware wallet comparison.
Disclosure: Some of the providers mentioned in this article work with us through partner programmes. This has no influence on the price analysis or on the assessment of the chart situation; the price data come from a public market data source and can be verified there.
(As of 3 October 2026. This article is not investment advice. Prices, fees and terms change; check them with the provider before every purchase. Crypto assets are subject to high price volatility, and a total loss is possible.)
Transparency note: This article was produced with the assistance of artificial intelligence and reviewed by our editorial team before publication. All figures and claims were checked against the primary sources linked in the text. The feature image was generated with AI.
Which topics should we dive deeper into?
Select what genuinely interests you. Your picks feed directly into our editorial planning.
Crypto news that's actually worth your time.
Weekly. 60 seconds. Carefully curated by our editors: no hype, no promo flood, no spam.
More from CryptoTicker