
Bitcoin Price Prediction for 2026: What History Told Us, and How the Year Is Going
At the end of 2025 we asked what history says about Bitcoin in 2026. Nine months in, the bearish scenario has played out: BTC fell to about $58,600 in July and trades near $84,200.





Which topics should we dive deeper into?
Select what genuinely interests you. Your picks feed directly into our editorial planning.
Crypto news that's actually worth your time.
Weekly. 60 seconds. Carefully curated by our editors: no hype, no promo flood, no spam.
Update 26 September 2026: Nine months into 2026, the bearish scenario below has come closest. According to CoinGecko daily data, Bitcoin peaked at about $96,900 on 15 January, fell to its 2026 low of about $58,600 on 1 July and trades at about $84,200 on 26 September 2026, about 4% below its level on 1 January. The macro pressure named below as the bearish trigger arrived: tariffs, no rate cuts and a Fed hike in September. The December analysis follows as a dated snapshot.
If you want to buy Bitcoin today, our comparison of Bitcoin providers shows where and at what cost.
How is Bitcoin doing in 2026 so far?
| Date | Bitcoin (CoinGecko, daily) |
|---|---|
| 1 January 2026 | about $87,600 |
| 15 January 2026 (2026 high) | about $96,900 |
| 1 July 2026 (2026 low) | about $58,600 |
| 26 September 2026 | about $84,200, about 4% below 1 January |
The statement below that deep pullbacks of 20 to 30% occur even in good years understated 2026: from the January high to the July low BTC lost about 40%. How this cycle compares with 2021 is covered in Is this crypto cycle like 2021?, why the Fed raised rates in 3 reasons crypto is holding strong after the Fed hike, and current targets in our Bitcoin price prediction.
The analysis from 25 December 2025
$Bitcoin has never moved in a straight line. Every major rally has been followed by a painful correction, and every deep bear market has eventually set the stage for a new expansion phase. As 2026 approaches, investors are once again asking the same question: is Bitcoin preparing for another major leg higher, or is a prolonged cooling period ahead?
To answer that, we need to step back and look at how Bitcoin has behaved over the years, especially across bullish and bearish cycles.
Bitcoin’s Long-Term Price Behavior: A Cycle-Driven Market
Looking at the weekly Bitcoin chart, one thing becomes clear: Bitcoin moves in cycles, not trends that last forever.
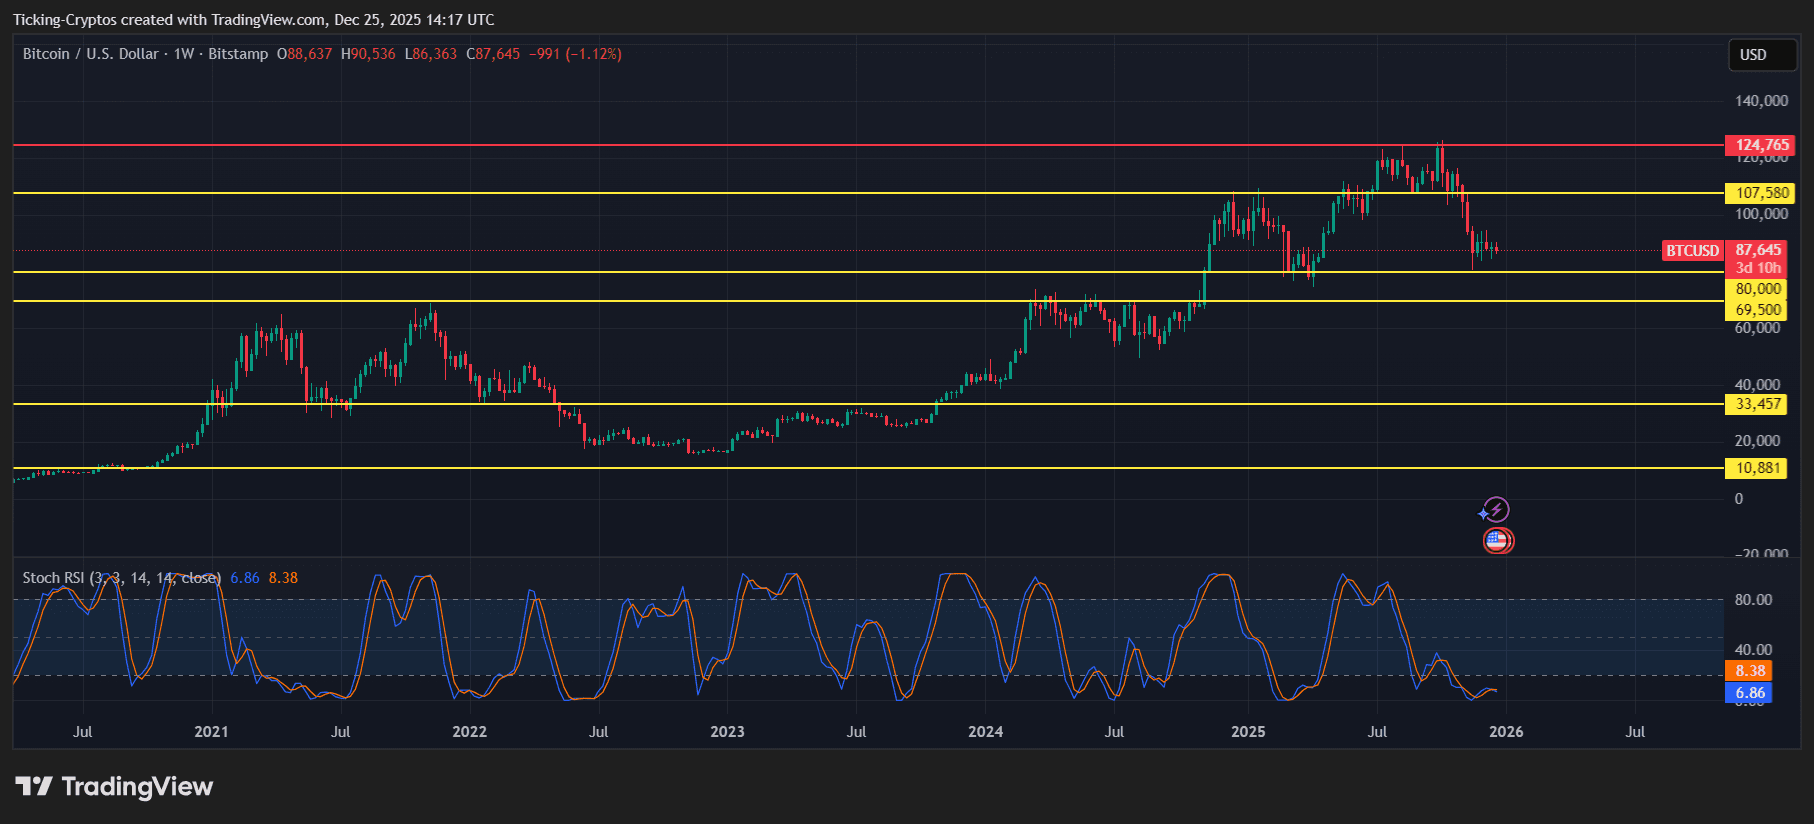
BTC/USD 1W - TradingView
Historically, BTC has followed a rhythm tied to liquidity, macro conditions, and halving events:
- Strong multi-year uptrends are followed by sharp corrections
- Extended consolidation phases often come before explosive rallies
- Major support zones tend to hold across multiple cycles
On the long-term chart, Bitcoin has respected key psychological levels for years. Once broken, these levels often flip from resistance into long-term support, a pattern that continues to shape expectations for 2026.
Monthly Returns Reveal a Clear Pattern
The Bitcoin monthly returns heatmap reinforces this cyclical nature.
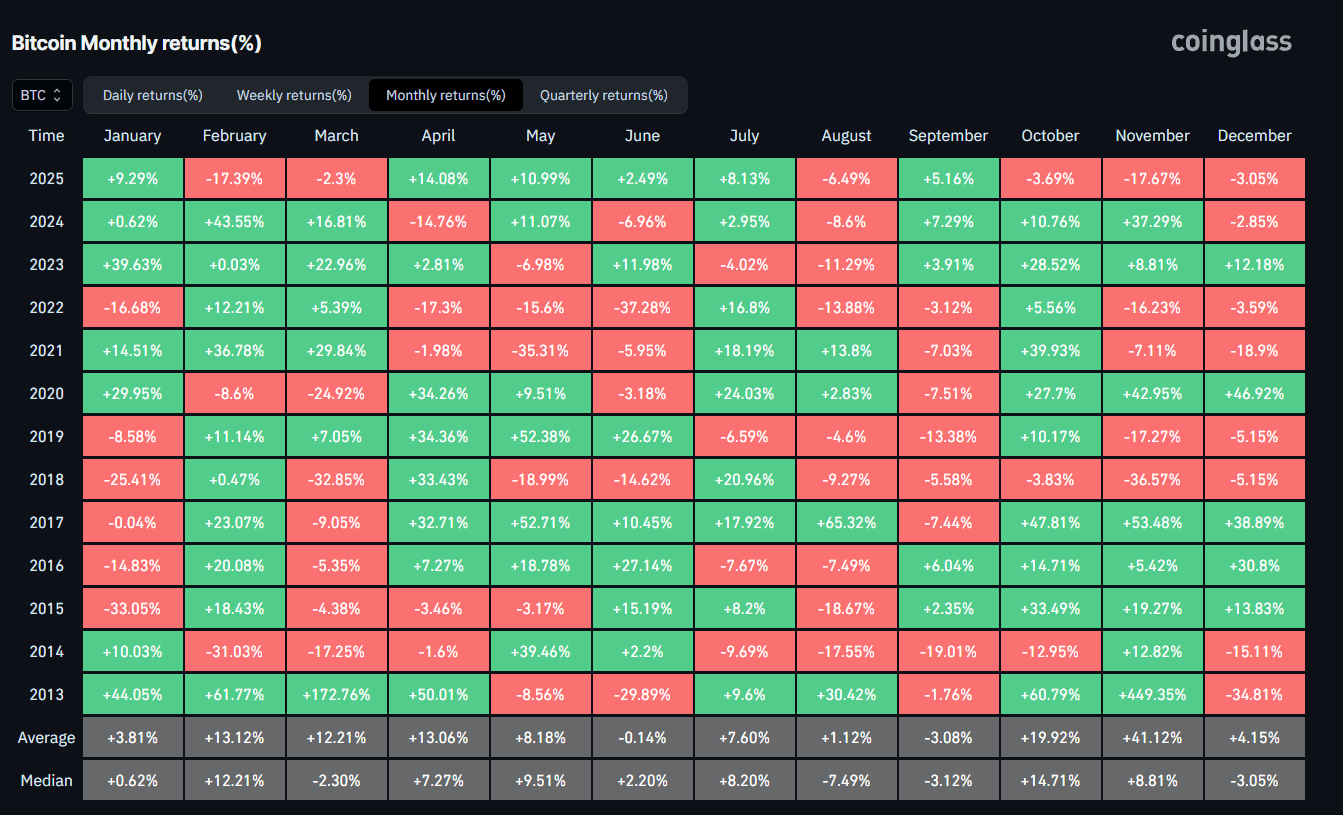
Bitcoin Monthly Returns over the past years - coinglass
Over the past decade:
- Bull years show clusters of strong green months, often stacking double-digit gains
- Bear years are marked by extended red periods and sharp drawdowns
- Certain months, like October and November, have historically delivered outsized gains, while others tend to be more mixed
What stands out is that even in bullish years, Bitcoin experiences deep pullbacks, sometimes exceeding 20 to 30%. This is critical when thinking about 2026: volatility is not a bug in Bitcoin, it’s a feature.
Where Bitcoin Stands Heading Into 2026
From a technical perspective, Bitcoin is entering 2026 after a period of heavy consolidation following a major expansion phase. Price action suggests:
- Long-term buyers are still defending key support zones
- Momentum has cooled compared to peak rally conditions
- Volatility has compressed, which historically precedes large moves
This type of market structure has often appeared mid-cycle, rather than at absolute tops or bottoms.
Bitcoin Price Prediction for 2026: Bullish vs Bearish Scenarios
Bullish Scenario
If liquidity conditions improve and risk appetite returns:
- Bitcoin could reclaim higher resistance zones and push toward new cycle highs
- Long-term accumulation near major support levels may fuel another expansion phase
- A renewed macro tailwind could trigger a strong second leg of the bull cycle
In this case, 2026 could resemble previous continuation years rather than a full market top.
Bearish Scenario
If macro pressure persists and liquidity tightens:
- Bitcoin may remain range-bound or experience a deeper correction
- Previous cycle support zones would come back into focus
- Sideways price action could dominate large parts of the year
Historically, Bitcoin has also spent entire years consolidating before resuming its long-term uptrend.
What History Suggests About 2026
Looking purely at historical behavior:
- Bitcoin rarely peaks and collapses instantly
- Post-rally years often alternate between continuation and consolidation
- Long-term holders tend to accumulate during periods of uncertainty
This makes 2026 less about chasing parabolic moves and more about positioning, patience, and risk management.
 Buy Bitcoin: Providers Compared
Transparency note: This article was produced with the assistance of artificial intelligence and reviewed by our editorial team before publication. All figures and claims were checked against the primary sources linked in the text. The feature image was generated with AI.
Related articles
- Ethereum Price Prediction for 2026: Can ETH Hold Its Long-Term Structure?
- Crypto Market Crash News As BTC Price Crash Back To 56K
- Bitcoin Price Analysis: What to Expect for the Rest of February 2026
- Bitcoin Price Prediction: Can BTC Recover After the Drop to $66K?
- Bitcoin Price Prediction: How Will BTC Price Move Following Gold's Surge?
Which topics should we dive deeper into?
Select what genuinely interests you. Your picks feed directly into our editorial planning.
Crypto news that's actually worth your time.
Weekly. 60 seconds. Carefully curated by our editors: no hype, no promo flood, no spam.

December 12, 2024 11:28 AM

Bitcoin Hits $100K Again – But a Crash to $60K Might Be Next
Bitcoin is back at $100K after dropping to $94K, but concerns are growing as BTC faces strong resistance at $104K. Will the bullrun continue, or is a major crash coming in January?
January 12, 2026 12:25 PM
Is This Crypto Cycle Like 2021? The January 2026 Analysis in Hindsight
In January 2026 much spoke against a repeat of 2021. It turned out harsher: Bitcoin lost more than half of its value from the cycle high near $124,700 by July 2026.
April 22, 2026 9:11 AM

Bitcoin Price Hits $78,000 as Ceasefire Extension Ignites Bullish Momentum
Bitcoin breaches $78,000 following the US-Iran ceasefire extension and a $2.5 billion MSTR purchase. Here is the weekly BTC chart for key 2026 price targets.
March 15, 2025 5:40 PM

Bitcoin Price Prediction March 2025 with FOMC and TRUMP in Play
Bitcoin price prediction for March 2025 is one to expect, ahead of the upcoming FOMC meeting and Trump's strategic crypto reserve. What to expect for BTC price?

March 22, 2026 1:16 PM

Bitcoin Price Prediction: This Might Be the BEST TIME to Trade BTC for Profit...
Bitcoin price hovers near $69,000 as volatility returns. Here are the latest Bitcoin price predictions and professional strategies to profit from this market phase.
October 21, 2025 4:17 PM

Bitcoin Surges Past $112,000 as the Fed Opens Doors to Crypto: What’s Next?
Bitcoin jumps above $112,000 after the U.S. Federal Reserve hinted at granting crypto firms access to its payment network. Here’s what this means for BTC and the broader market.
September 1, 2024 1:30 PM

Bitcoin Price Prediction: How Will September Unfold For BTC Price?
Bitcoin price is facing significant market volatility, as it hovers around $58,000. What are the key indicators and on-chain data shaping the future of BTC Price, and how will September unfold?
February 27, 2026 5:23 PM

Bitcoin Price Analysis: BTC Drops to $65K as Market Enters Critical Consolidation Phase
Bitcoin price faces a sharp correction to $65,000. Here's the latest BTC analysis, key support levels, and why the market is entering a consolidation phase.
November 1, 2025 9:05 AM

Crypto Market Performance: Why November Could Be the Next Big Month
Crypto markets have turned bullish again. Here’s why November 2025 could be another strong month for Bitcoin and altcoins.
May 2, 2026 4:56 PM

Crypto Price Prediction May 2026: Bitcoin Targets $90,000 as Altcoins Prep for Breakouts
Bitcoin eyes $90,000 in May 2026. Ethereum, XRP, and Cardano prepare for major breakouts contingent on a bullish BTC trend.
March 4, 2025 9:17 PM

Bitcoin Price Prediction ahead of the Upcoming White House Crypto Summit
With the remarkable Bitcoin volatility, and after briefly surging earlier this week before dropping again. Is a Bitcoin price surge expected ahead of or after the upcoming White House Crypto Summit?
January 14, 2026 3:42 PM

Did Bitcoin Reach $100K in January 2026? What Happened After the Rally to $97,000
On 14 January 2026 Bitcoin climbed above $97,000 and $100,000 looked close. It never got there: BTC fell to about $58,600 by July and trades near $84,200 today.
August 24, 2024 5:58 PM

Bitcoin Price Prediction: BTC Surges 4% to Break $62K, Targets $66K Next
BTC jumps 4% in the past 24 hours, breaking through the $62,000 resistance. With the entire crypto market following suit, can Bitcoin maintain its bullish momentum?
September 3, 2024 10:19 AM

How Important Is The $70k Level For BTC Price Bullish Momentum?
Bitcoin's $70k level is highly important to keep its bullish momentum, but will BTC Price keep its uptrend this September?
August 4, 2024 12:18 PM

Bitcoin Price Prediction: Will BTC Rebound or Crash Below Key Support?
Bitcoin has experienced a significant price drop, falling from $67.5K to around $60,750 over the past week. What's next for Bitcoin price?
July 1, 2024 9:20 AM

Bitcoin News Today: Why Is Bitcoin Price Up Starting July?
Starting July, recent market movements, political debates, and court rulings are shaping the future of Bitcoin and the broader crypto market. Here are the latest insights and analysis...
April 18, 2026 11:17 AM

Bitcoin Price Targets $90,000: Why the $78,000 Weekly Close is Critical
Bitcoin is eyeing a major breakout. A weekly close above $78,000 could trigger a massive rally toward the $90,000 mark in the coming weeks.
February 20, 2025 2:00 PM

Bitcoin Price Prediction: Is BTC Ready to Break $100K Again?
Bitcoin's price is showing signs of a strong rebound, hinting at a potential breakout past $100,000. With the entire crypto market inching higher, traders are eyeing key resistance levels for the next big move.
April 9, 2026 4:02 PM

Oil Back at $100, Inflation Rising — Why Crypto’s Next Move Could Be Violent
Oil above $100 is fueling inflation fears and pressuring crypto markets. Will Bitcoin crash or surge next? Key levels and scenarios explained.
August 12, 2025 2:05 PM

Crypto Market Outlook After US Inflation Data: Bitcoin Eyes $125K as CPI Hits 2.7%
US CPI lands at 2.7%, boosting hopes for September rate cuts. Bitcoin eyes $125K while altcoins prepare for possible rallies.
March 30, 2026 6:35 PM

Tech Giants Lose $5 Trillion: Why Crypto Is Holding Steady (For Now)
The Magnificent 7 tech giants have wiped out $5 trillion in market value. While crypto prices remain stable today, historical trends suggest a potential shift.
April 20, 2026 5:18 PM

Bitcoin Breakout or Breakdown? The $74K Level That Will Decide Everything
Bitcoin hovers near $74K as markets await a breakout or breakdown. Key levels, CME gaps, and macro risks could decide the next move.
July 7, 2024 6:40 PM

Will BTC Price Crash Again After The Dormant Bitcoin Whale Move?
A decade dormant Bitcoin Whale just moved 140 BTC. Is it a sign of a new BTC price crash or surge soon? What is there to know...
April 20, 2026 9:30 AM

Crypto Market on Edge: Whale Bets, War Tensions, and Why the Real Move Isn’t Here Yet
Crypto sits at a tipping point as whale bets, geopolitical tensions, and weak momentum signal a major move ahead. Is volatility about to explode?
March 21, 2026 7:32 PM

Why Bitcoin Is Ignoring the Iran War — Markets Are Sending a Strange Signal
Bitcoin holds steady despite Iran war tensions and rising oil prices. Why is crypto ignoring geopolitical risk?


More from CryptoTicker