
Bitcoin Price Analysis: First Week of 2026 Saw Sideways Action as ETF Outflows Hit, and What Came Next
In the first week of 2026 Bitcoin moved sideways near $90,000 while ETFs sold. The range broke lower: the $85,300 and $80,000 supports gave way in February.





Which topics should we dive deeper into?
Select what genuinely interests you. Your picks feed directly into our editorial planning.
Crypto news that's actually worth your time.
Weekly. 60 seconds. Carefully curated by our editors: no hype, no promo flood, no spam.
Update 26 September 2026: The sideways phase first broke higher, then sharply lower. According to CoinGecko daily data, Bitcoin climbed to about $96,900 by 15 January but did not reach $100,000. From 20 January the price fell through the $85,300 and $80,000 supports named below and reached its 2026 low of about $58,600 on 1 July. On 26 September 2026 Bitcoin trades at about $84,200. The analysis from 9 January follows as a dated snapshot.
If you want to buy Bitcoin today, our comparison of Bitcoin providers shows where and at what cost.
What became of the range between $85,300 and $94,500?
| Date | Bitcoin (CoinGecko, daily) |
|---|---|
| 9 January 2026 | about $91,000 |
| 15 January 2026 (2026 high) | about $96,900 |
| 6 February 2026 | about $62,800 |
| 1 July 2026 (2026 low) | about $58,600 |
| 26 September 2026 | about $84,200 |
The drop after 20 January was triggered by US tariff threats against European countries over Greenland, covered in our report on the crypto crash of 20 January. The rate relief hoped for below did not come: the Federal Reserve did not cut in 2026 and raised its target range by a quarter point to 3.75% to 4% on 16 September, see 3 reasons crypto is holding strong after the Fed hike. Current levels are in our Bitcoin price prediction.
The analysis from 9 January 2026
Bitcoin Price Analysis: Sideways Start to 2026
$Bitcoin has kicked off the first week of 2026 with sideways price action, showing hesitation after the strong volatility seen at the end of 2025. As traders assess macroeconomic signals and institutional flows, BTC remains range-bound, struggling to establish a clear short-term trend.
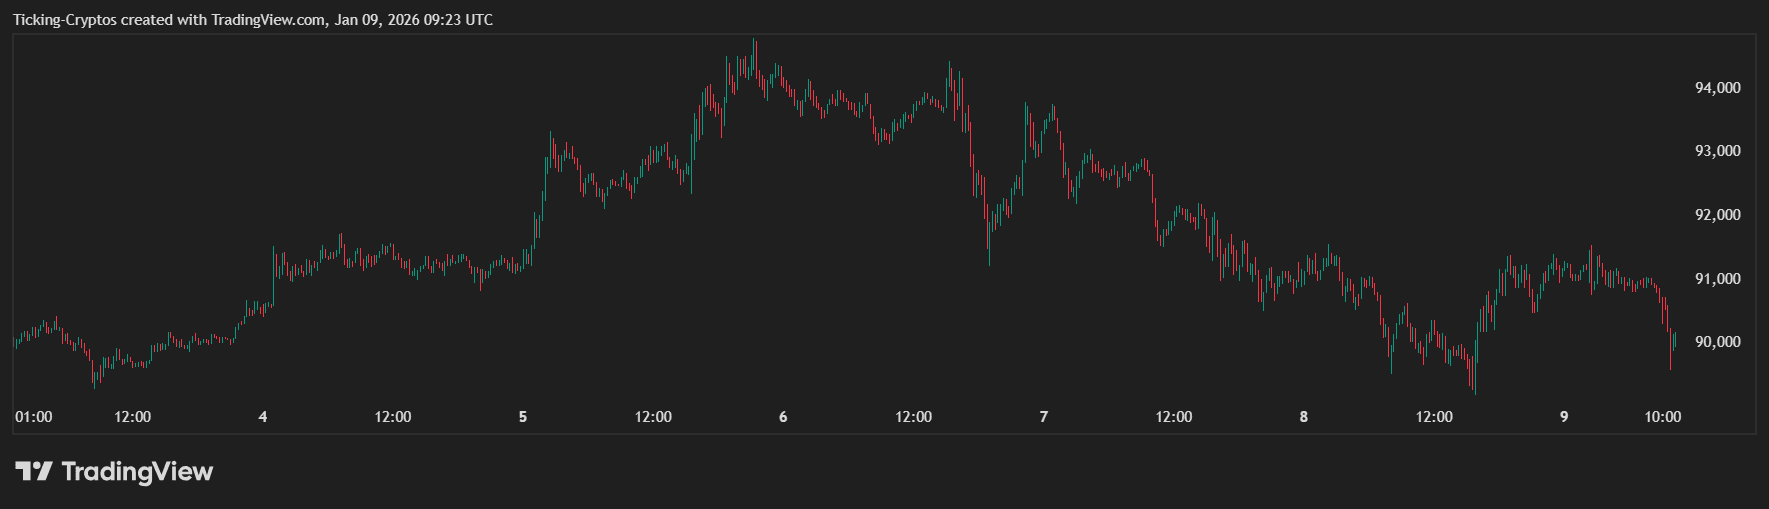
Bitcoin price in the past week - TradingView
At the time of writing, Bitcoin is trading near $90,000, caught between well-defined support and resistance zones.
Bitcoin Analysis: Clear Range With No Breakout Yet
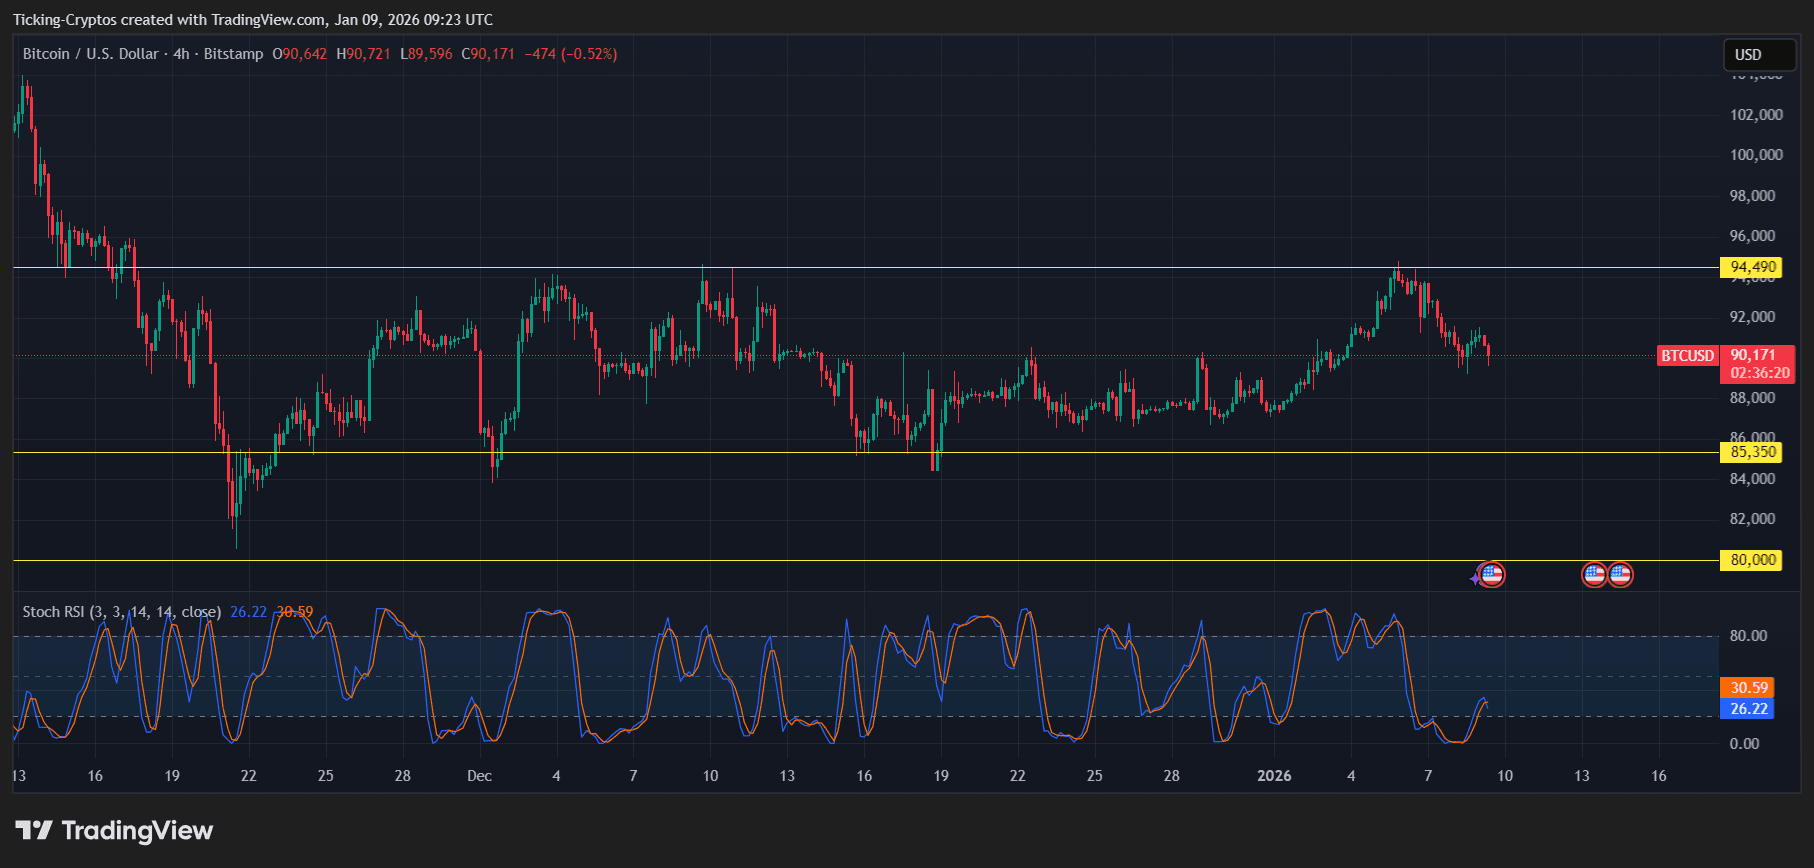
Looking at the 4-hour BTC/USD chart, Bitcoin is still moving inside a horizontal range, confirming consolidation rather than trend continuation.
- Key resistance: ~$94,500
- Key support: ~$85,300
- Lower psychological level: ~$80,000
Price has repeatedly failed to break above the $94.5K resistance, while buyers continue to step in above the $85K area, keeping Bitcoin locked in a sideways structure.
BTC/USD 4H - TradingView
Momentum indicators support this view. The Stochastic RSI is currently hovering near oversold territory, suggesting short-term relief bounces are possible, but without strong volume, any upside move remains limited.
As long as Bitcoin stays within this range, the market remains in wait-and-see mode.
ETF Outflows Add Bearish Pressure
Adding to the cautious tone, Bitcoin and Ethereum ETFs saw notable outflows this week:
- $400.2 million worth of $Bitcoin sold
- $159.9 million worth of $Ethereum sold
These outflows, including activity linked to BlackRock and other major ETF issuers, signal reduced institutional appetite in the short term. While not a full trend reversal, the selling pressure explains why Bitcoin has struggled to reclaim higher levels above resistance.
US Unemployment Data: A Key Catalyst Ahead
Markets are now closely watching US unemployment data, scheduled for release at 8:30 AM ET today.
- Expected unemployment rate: 4.5%
This data point is critical. A higher-than-expected figure could fuel rate-cut expectations, potentially supporting Bitcoin and risk assets. Conversely, stronger labor data may reinforce a cautious Fed outlook, keeping pressure on crypto markets.
 Buy Bitcoin: Providers Compared
Bitcoin Prediction: What to Watch Next
For now, Bitcoin remains neutral to slightly bearish in the short term:
- A break above $94,500 could open the door toward $98,000 to $100,000
- A loss of $85,300 support would expose BTC to a deeper pullback toward $80,000
Until a decisive breakout occurs, traders should expect continued range trading, with macro data and ETF flows acting as the main drivers.
Transparency note: This article was produced with the assistance of artificial intelligence and reviewed by our editorial team before publication. All figures and claims were checked against the primary sources linked in the text. The feature image was generated with AI.
Related articles
- Bitcoin Price Prediction: Can BTC Recover After the Drop to $66K?
- Bitcoin Price Volatility Is Moving BTC Price Down, But For How Long?
- Bitcoin Price Hits $78,000 as Ceasefire Extension Ignites Bullish Momentum
- Bitcoin Price Prediction: Will BTC Rebound or Crash Below Key Support?
- Did Bitcoin Reach $100K in January 2026? What Happened After the Rally to $97,000
Which topics should we dive deeper into?
Select what genuinely interests you. Your picks feed directly into our editorial planning.
Crypto news that's actually worth your time.
Weekly. 60 seconds. Carefully curated by our editors: no hype, no promo flood, no spam.

July 25, 2026 11:27 AM

Crypto Price Today: Market Slides Again as Bitcoin Fails at $67,000
Bitcoin slipped back under $64,000 after tapping $66,990. Oil, ETF outflows and Fed nerves are dragging the whole crypto market lower.
August 28, 2024 6:12 PM

Breaking News: Will This Volatile Summer End With Bullish Signs For Bitcoin Price?
Bitcoin price summer volatility continues! Will it break out or fall further? Get expert analysis, key levels to watch, and industry leader predictions.
December 12, 2024 11:28 AM

Bitcoin Hits $100K Again – But a Crash to $60K Might Be Next
Bitcoin is back at $100K after dropping to $94K, but concerns are growing as BTC faces strong resistance at $104K. Will the bullrun continue, or is a major crash coming in January?
November 6, 2025 8:00 PM

Why Is the Crypto Market Flat Today? November 6, 2025
Crypto prices remain steady as Bitcoin holds above $101K and Ethereum slips below $3.4K. Whales keep buying ETH while ETF outflows weigh on BTC.
February 16, 2026 6:00 AM

Bitcoin Price Analysis: What to Expect for the Rest of February 2026
Bitcoin and the crypto market face heavy pressure in February 2026. Here are key levels and catalysts that could define the BTC price for the rest of the month.
September 1, 2024 1:30 PM

Bitcoin Price Prediction: How Will September Unfold For BTC Price?
Bitcoin price is facing significant market volatility, as it hovers around $58,000. What are the key indicators and on-chain data shaping the future of BTC Price, and how will September unfold?
July 8, 2024 7:51 AM
Crypto Market Crash News As BTC Price Crash Back To 56K
With the crypto market crash, and Bitcoin price drop to below 56k with recent dormant BTC whales activity, what comes next: a correction or further crash soon?
July 1, 2024 9:20 AM

Bitcoin News Today: Why Is Bitcoin Price Up Starting July?
Starting July, recent market movements, political debates, and court rulings are shaping the future of Bitcoin and the broader crypto market. Here are the latest insights and analysis...
April 15, 2026 12:00 PM

Bitcoin Price Corrects After $76,000 High: Is This a Consolidation or a Crash?
Bitcoin price faces a healthy correction after hitting $76,000. Learn how to trade consolidation phases and use support and resistance levels effectively.
August 25, 2026 3:56 PM

Bitcoin Price Cracks $80,000 Then Cools While Altcoins Push Higher
Bitcoin cleared 80,000 dollars for the first time since May, then slipped to 79,100. Chart analysis, upside targets and key support levels.

May 12, 2026 3:51 PM

Bitcoin Holds $80,000 as XRP Outpaces Market Amid ETF Surge
Bitcoin maintains its $80,000 support while XRP breaks key resistance. Discover how institutional ETF inflows and market shifts are driving crypto prices today.
May 10, 2026 1:29 PM
Solana Price Eyes $100 Breakout as Bitcoin Solidifies Gains Above $80k
Solana (SOL) targets the $100 psychological level while Bitcoin (BTC) holds firmly above $80,000, signaling a major shift in the 2026 crypto market structure.
April 30, 2024 2:52 PM

What Bitcoin Strategy yields $400M in Profits?
A Bitcoin Strategy adopted by a major company's co-founder reported to have earned him $400M in profits: Fact or Fiction?

May 26, 2020 12:42 PM

Bitcoin Price Analysis- Will BTC Price Overcome Fib Resistance?
The Bitcoin price tumbles between support and resistance. Is Bitcoin’s correction finally over? A few days ago, the Bitcoin price was displaying a downward path and confirmed a bearish trend. The MACD was in a strong downward movement and the […]
February 27, 2026 5:23 PM

Bitcoin Price Analysis: BTC Drops to $65K as Market Enters Critical Consolidation Phase
Bitcoin price faces a sharp correction to $65,000. Here's the latest BTC analysis, key support levels, and why the market is entering a consolidation phase.
December 10, 2024 12:30 AM

Bitcoin Price Drops Below $100K – Is a Bigger Crash Coming?
Bitcoin has fallen below $100K, triggering a broader market correction of over 8% in the last 24 hours. With profit-taking and large sell-offs hitting the market, could Bitcoin drop to $90K or lower?
December 24, 2025 5:30 PM

Crypto Market Analysis: Top 10 Cryptos Go Sideways During Christmas
Crypto prices remain largely flat as Bitcoin, Ethereum, and altcoins drift sideways during the Christmas holidays and low trading activity.
June 5, 2024 5:03 PM

Crypto Market Up: Bitcoin Breaches $71K, Altcoins Follow Suit, Eyes on New Highs
Cryptocurrencies are experiencing a surge, with Bitcoin leading the charge by surpassing $71,000. This bullish trend extends to altcoins, igniting optimism across the market. Will Bitcoin reach new highs?
August 7, 2026 2:16 PM

Bitcoin Price Analysis: Why BTC Rose Despite The Crypto Bill Delay
The Senate punted the CLARITY Act to September and Bitcoin rose anyway. The chart explains why, and it is not the story most people are telling.
June 18, 2024 10:15 PM

WHY Is Bitcoin (BTC) DOWN: Top 3 Reasons
Why is Bitcoin (BTC) down, is what everyone is concerned with. After market analysis, here are the top 3 reasons behind it...
June 25, 2024 6:26 PM

Solana Price Prediction: Will SOL Surpass 200$?
Why Solana, Shiba Inu, and Cardano are poised for a major rebound, according to the latest market analysis. Can Solana capitalize on the buy signals and reach a new price target?
July 11, 2026 2:16 PM

Bitcoin Price Prediction: Can BTC Reach $70,000 After the CPI Test?
Bitcoin is grinding higher into a make-or-break week. One level is capping the rebound, one macro event could decide the next move — here's what the chart says.
May 1, 2026 8:29 AM
Bitcoin Ends April with 11.87% Gain as Bulls Reclaim Key Support
Bitcoin closed April 2026 with an 11.87% gain, decisively finishing above the $75,900 monthly high and signaling a major shift in macro momentum.
July 30, 2024 11:18 AM

Bitcoin Price Crash: Did FOMC Meeting Drive $2B Transfer & ETF Outflows?
The $2 billion Bitcoin transfer and recent ETF outflows have influenced the cryptocurrency market negatively. What is next for the BTC price?
February 20, 2025 2:00 PM

Bitcoin Price Prediction: Is BTC Ready to Break $100K Again?
Bitcoin's price is showing signs of a strong rebound, hinting at a potential breakout past $100,000. With the entire crypto market inching higher, traders are eyeing key resistance levels for the next big move.


More from CryptoTicker