
Bitcoin Price Analysis, January 2026: BTC Targeted $100k as the Russell 2000 Rallied
On 16 January 2026 the Russell 2000 record seemed to open the way to $100,000 for Bitcoin. BTC never got there: it fell to about $58,600 by July.




Which topics should we dive deeper into?
Select what genuinely interests you. Your picks feed directly into our editorial planning.
Crypto news that's actually worth your time.
Weekly. 60 seconds. Carefully curated by our editors: no hype, no promo flood, no spam.
Update 26 September 2026: The Russell 2000 signal did not carry Bitcoin. According to CoinGecko daily data, BTC reached its 2026 high of about $96,900 on 15 January and never crossed $100,000. It then fell to its 2026 low of about $58,600 on 1 July and trades at about $84,200 on 26 September 2026. The $120,000 to $150,000 range mentioned below was never approached. The January analysis follows as a dated snapshot.
Why didn't Bitcoin follow the small caps?
| Date | Bitcoin (CoinGecko, daily) |
|---|---|
| 15 January 2026 (2026 high) | about $96,900 |
| 16 January 2026 | about $95,600 |
| 6 February 2026 | about $62,800 |
| 1 July 2026 (2026 low) | about $58,600 |
| 26 September 2026 | about $84,200 |
Four days after this analysis, US tariff threats against European countries over Greenland triggered a sell-off, covered in our report on the crypto crash of 20 January. Instead of the rate cuts hoped for, the Federal Reserve raised its target range to 3.75% to 4% on 16 September, see 3 reasons crypto is holding strong after the Fed hike. Current levels are in our Bitcoin price prediction.
The analysis from 16 January 2026
The financial landscape in January 2026 is shifting rapidly. While large-cap tech has dominated the headlines for years, a new leader has emerged: the Russell 2000. The index, which tracks 2,000 small-cap U.S. companies, has just surged to a fresh all-time high (ATH), signaling a powerful "risk-on" rotation. For $Bitcoin, this stock market breakout is the fuel needed to finally clear the psychological $100,000 barrier.
The Russell 2000 Breakout: A Macro Green Light
The Russell 2000 is often viewed as the "canary in the coal mine" for economic health and investor bravery. Unlike the S&P 500, which is weighted toward stable giants, the Russell 2000 represents growth and volatility.
When small-caps hit an ATH, it tells us that liquidity is flowing into the broader market. Historically, as seen in the crypto news cycles of 2017 and 2021, a surging Russell 2000 often precedes a massive leg up for BTC. Investors who have secured profits in equities are now looking for the next high-growth play, and Bitcoin is the primary destination.
Bitcoin YTD Analysis: The Path to $100,000
Looking at the 2026 charts, Bitcoin has started the year with a strong bullish posture. After a brief period of consolidation in early January, the price has found solid support.
- Current Price: ~$95,600
- YTD Performance: +9.2%
- Market Dominance: 57.5%
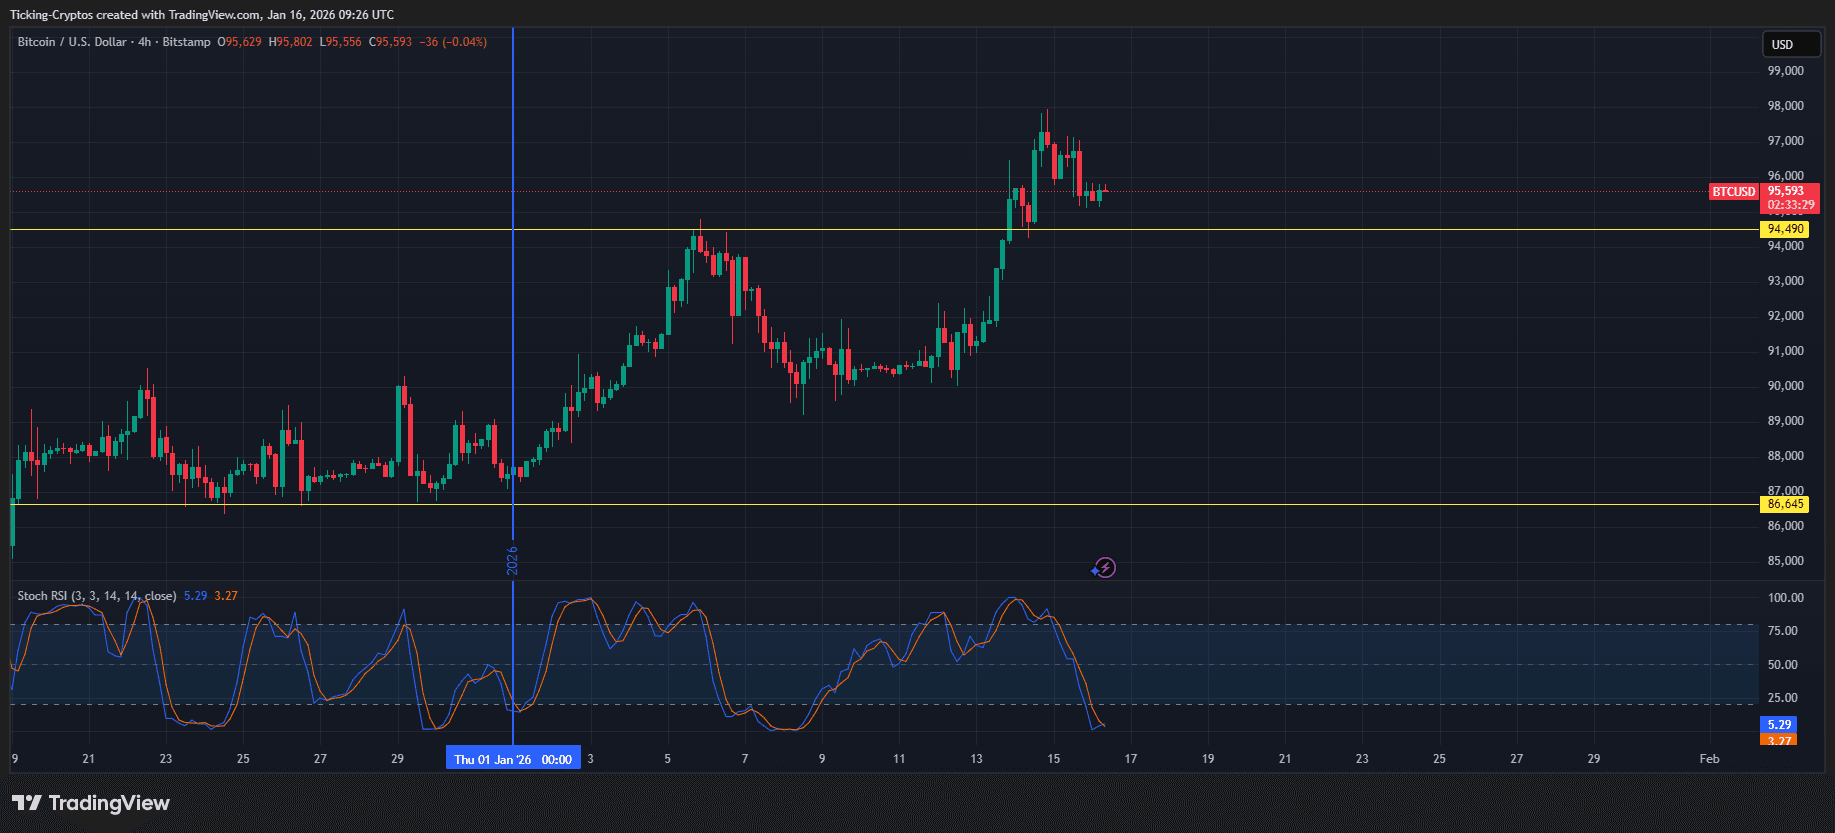
BTC/USD 4H - TradingView
The technical structure on the daily chart shows a "cup and handle" pattern forming just below the six-figure mark. With the Russell 2000 outperforming the Nasdaq for ten consecutive sessions, the longest streak since 1990, the environment for trading riskier assets has never been more favorable. If Bitcoin can maintain its position above $94,000, a move toward $100,000 is not just possible; it is expected by the end of Q1.
Institutional "Stacking" and Market Sentiment
It’s not just retail traders driving this move. Institutional players are increasingly treating Bitcoin as "digital gold" with a high-beta twist. According to recent market data, the Fear & Greed Index is currently sitting at a "Neutral" 49. This is actually a very bullish sign; it means the current rally isn't driven by blind euphoria but by calculated capital allocation.
Many of these investors are moving their assets into secure hardware wallets, reducing the available supply on exchanges. This "supply shock," combined with the macro tailwinds from the equity markets, creates a perfect storm for a price discovery phase.
What’s Next for BTC Price?
As the Russell 2000 continues its price discovery in uncharted territory, the correlation suggests Bitcoin is next. The $100,000 level is the final boss for the bulls. Breaking it would likely trigger a wave of FOMO that could push the market toward the $120,000 to $150,000 range predicted by many analysts for later this year.
Transparency note: This article was produced with the assistance of artificial intelligence and reviewed by our editorial team before publication. All figures and claims were checked against the primary sources linked in the text.
Related articles
- $1 Trillion Wiped: Risk-Off Storm Engulfs Stocks & Crypto
- Bitcoin Price Hits $78,000 as Ceasefire Extension Ignites Bullish Momentum
- What Threat Could Crash the Crypto Market? War-End Rally Faces Hidden Risk
- Bitcoin Price Analysis: BTC Drops to $65K as Market Enters Critical Consolidation Phase
- Bitcoin Price Prediction: Can BTC Price Record A New All Time High Before End Of July?
Which topics should we dive deeper into?
Select what genuinely interests you. Your picks feed directly into our editorial planning.
Crypto news that's actually worth your time.
Weekly. 60 seconds. Carefully curated by our editors: no hype, no promo flood, no spam.

July 1, 2024 9:20 AM

Bitcoin News Today: Why Is Bitcoin Price Up Starting July?
Starting July, recent market movements, political debates, and court rulings are shaping the future of Bitcoin and the broader crypto market. Here are the latest insights and analysis...
January 14, 2026 3:42 PM

Did Bitcoin Reach $100K in January 2026? What Happened After the Rally to $97,000
On 14 January 2026 Bitcoin climbed above $97,000 and $100,000 looked close. It never got there: BTC fell to about $58,600 by July and trades near $84,200 today.
July 8, 2024 7:51 AM

Crypto Market Crash News As BTC Price Crash Back To 56K
With the crypto market crash, and Bitcoin price drop to below 56k with recent dormant BTC whales activity, what comes next: a correction or further crash soon?
April 18, 2026 11:17 AM

Bitcoin Price Targets $90,000: Why the $78,000 Weekly Close is Critical
Bitcoin is eyeing a major breakout. A weekly close above $78,000 could trigger a massive rally toward the $90,000 mark in the coming weeks.
April 8, 2026 8:53 AM
Bitcoin Price Hits $71,000 as Trump Announces Two-Week Ceasefire
Bitcoin price surged past $71,000 following President Trump’s announcement of a two-week ceasefire with Iran, sparking a major relief rally across global markets.
June 24, 2024 8:16 PM

Bitcoin News Today: Bitcoin CRASH OVER or MORE Down To Go?
Bitcoin Price Crash below 60k, and the crypto market follows. Why this decline and how low can it go?
September 1, 2024 1:30 PM

Bitcoin Price Prediction: How Will September Unfold For BTC Price?
Bitcoin price is facing significant market volatility, as it hovers around $58,000. What are the key indicators and on-chain data shaping the future of BTC Price, and how will September unfold?
March 14, 2026 9:45 AM

War in the Middle East: Stock Market Bleeds $2.4 Trillion While Crypto Gains Ground
The US-Iran war triggers a $2.4T stock market wipeout while crypto gains $250B. Discover why the total crypto market cap is up 5% amid global conflict.
September 4, 2024 8:10 PM

Bitcoin Price Volatility Is Moving BTC Price Down, But For How Long?
As Bitcoin price faces market turbulence, the factors driving its recent volatility, from stock market impacts to key technical indicators signaling potential price shifts are highly important...

March 19, 2026 2:30 PM

Bitcoin News Today: Why BTC Dropped Below $70,000 After a Massive Rally
Bitcoin news today shows BTC dropping below $70,000 as rising oil prices and a hawkish Federal Reserve halt the recent crypto market rally.
March 21, 2026 7:32 PM

Why Bitcoin Is Ignoring the Iran War — Markets Are Sending a Strange Signal
Bitcoin holds steady despite Iran war tensions and rising oil prices. Why is crypto ignoring geopolitical risk?
March 6, 2026 10:51 AM
Bitcoin Price Today: BTC Faces $70,000 Support as ETF Outflows Resume
Bitcoin price analysis for March 6, 2026, shows BTC testing the $70,000 level as ETF outflows and geopolitical tensions in Iran spark market volatility.
January 25, 2026 11:55 AM
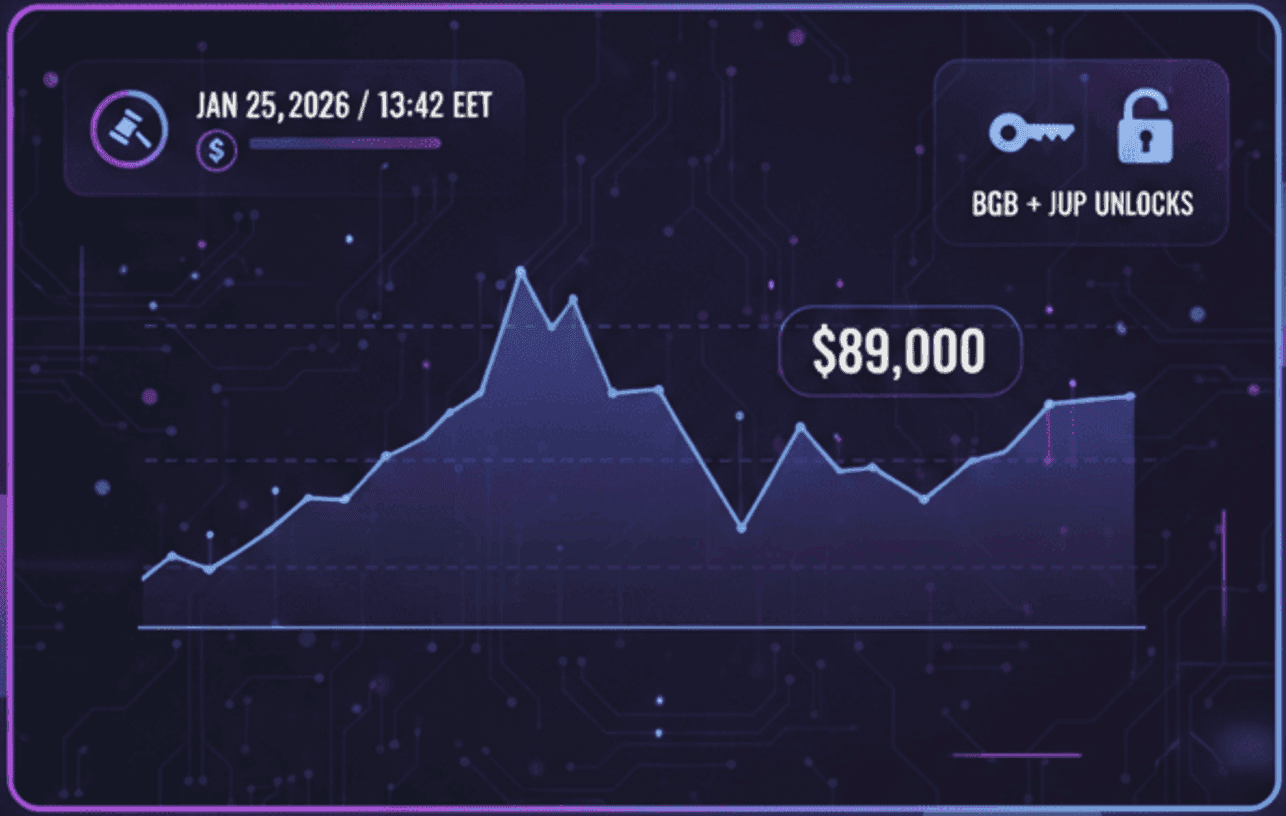
Crypto Ticker News Week 4: Bitcoin Stabilizes as Fed and Unlocks Loom
Bitcoin fights to hold $89k in Week 4 of 2026. Crypto news of the week includes the impact of the upcoming FOMC meeting and major token unlocks for JUP and BGB.
March 10, 2026 8:47 AM

Bitcoin Reclaims $70,000: Why is BTC Price Surging Despite Middle East Tensions?
Bitcoin price has surged back above the $70,000 mark. Explore the technical chart analysis and how Middle East instability is shaping the current BTC rally.
October 21, 2025 4:17 PM

Bitcoin Surges Past $112,000 as the Fed Opens Doors to Crypto: What’s Next?
Bitcoin jumps above $112,000 after the U.S. Federal Reserve hinted at granting crypto firms access to its payment network. Here’s what this means for BTC and the broader market.
June 25, 2024 12:18 PM

After Bitcoin Crash, Will Altcoins Gains Reach 500%?
In the latest Bitcoin News today, and mainly after the Bitcoin Crash, crypto analysts predict a major shift towards altcoins with market corrections near the end and BTC dominance drop. Will the altcoins gain reach 500%?
March 4, 2026 11:36 AM
Bitcoin Price Breaks $70K Barrier as Geopolitical Chaos Ignites Safe-Haven Demand
Bitcoin price clears the $70,000 psychological barrier as rising Middle East tensions drive investors toward decentralized assets and "digital gold" narratives.
May 13, 2026 6:52 PM

Why Did Bitcoin Price Crash below 80k Today?
The crypto market is in turmoil as Bitcoin and Ethereum lose critical support levels. What triggered the sudden price collapse?
May 10, 2026 1:29 PM
Solana Price Eyes $100 Breakout as Bitcoin Solidifies Gains Above $80k
Solana (SOL) targets the $100 psychological level while Bitcoin (BTC) holds firmly above $80,000, signaling a major shift in the 2026 crypto market structure.
May 6, 2026 3:16 PM

Trump Warns Iran: Bitcoin Price Dips to $81,600 as Geopolitical Tensions Flare
Bitcoin drops from $82,800 to $81,600 following Trump’s latest Iran warning. Is this a trend reversal or just a healthy market correction?
May 2, 2026 4:56 PM
Crypto Price Prediction May 2026: Bitcoin Targets $90,000 as Altcoins Prep for Breakouts
Bitcoin eyes $90,000 in May 2026. Ethereum, XRP, and Cardano prepare for major breakouts contingent on a bullish BTC trend.
March 9, 2026 10:20 AM

Crypto Market News: Bitcoin Price Battles $67k as US CPI and CLARITY Act Loom
Bitcoin recovers to $67,500 while the market eyes US CPI data and the CLARITY Act. Discover the key events driving crypto prices next week.
April 20, 2024 4:07 PM

What Happened To Cryptos After Bitcoin (BTC) Halving Today?
Today's cryptocurrency market highlights: Bitcoin over $64k and Ethereum towards $3,1k. But what about altcoins?
August 28, 2024 6:12 PM

Breaking News: Will This Volatile Summer End With Bullish Signs For Bitcoin Price?
Bitcoin price summer volatility continues! Will it break out or fall further? Get expert analysis, key levels to watch, and industry leader predictions.
March 27, 2026 9:48 PM

$900 Billion Surge — But Markets May Be Pricing a Peace That Doesn’t Exist
$900B added to US stocks as Bitcoin surges and oil crashes after Trump’s Iran statement—but is the market pricing a false peace?


More from CryptoTicker