
DefiLlama explained: how to read the DeFi data correctly
What DefiLlama measures and how to read TVL, fees, revenue, stablecoins and yields correctly: a guide with our own data analysis and six common reading mistakes.





Which topics should we dive deeper into?
Select what genuinely interests you. Your picks feed directly into our editorial planning.
Crypto news that's actually worth your time.
Weekly. 60 seconds. Carefully curated by our editors: no hype, no promo flood, no spam.
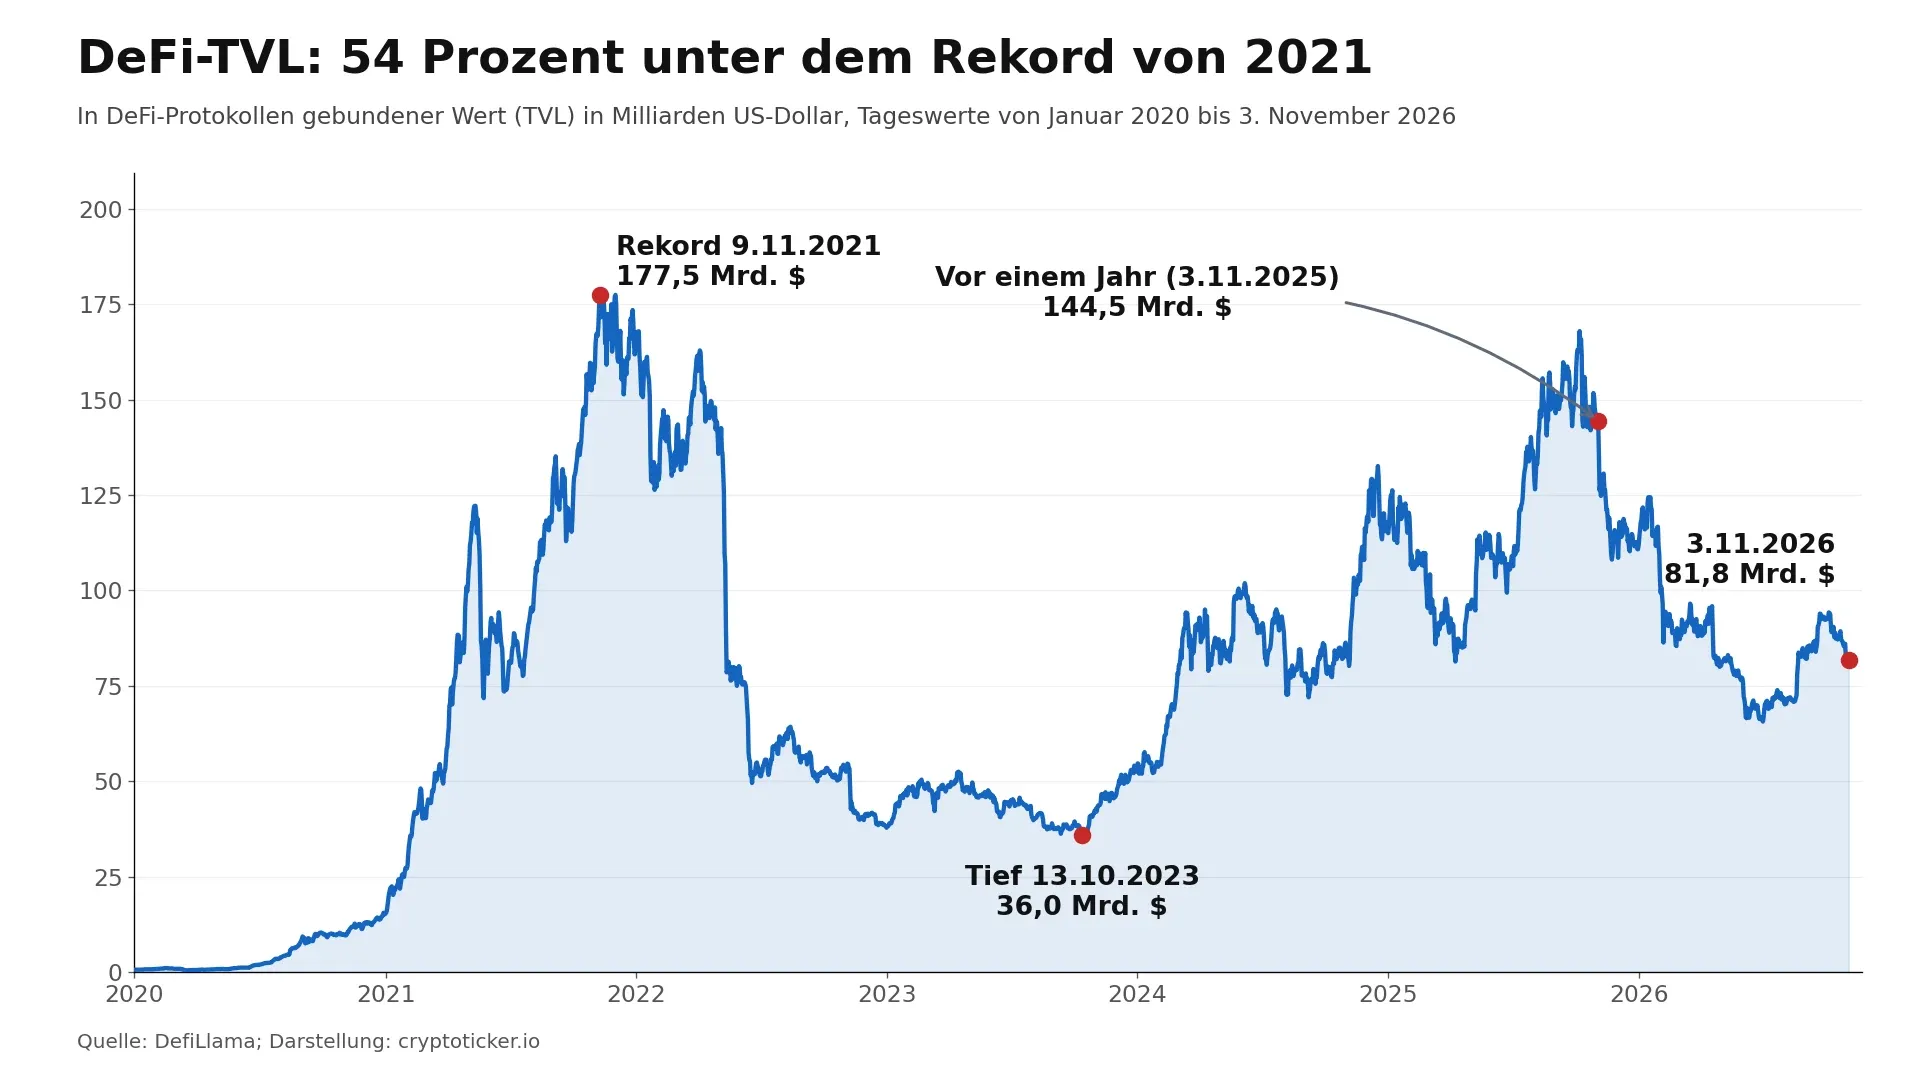
DefiLlama is the largest freely accessible data platform for decentralized finance (DeFi). It shows how much capital sits in crypto protocols such as Aave, Lido or Uniswap, how much these protocols earn in fees, which stablecoins are in circulation and what yields pools are currently paying. The data is free, available without registration, and the methodology is public. On November 3, 2026, according to DefiLlama, $81.8 billion was locked in DeFi, 53.9 percent below the record of November 9, 2021. How to read TVL, fees, revenue, stablecoins and yields correctly, and where even experienced investors take a wrong turn, we show here using our own analysis of DefiLlama data.
DefiLlama at a glance: the key numbers
- On November 3, 2026, $81.8 billion sat in DeFi protocols, compared with $144.5 billion a year earlier.
- Ethereum accounts for $43.6 billion of that, or 53.2 percent; DefiLlama tracks 290 blockchains with locked capital.
- Measured in ether, the capital on Ethereum fell by only 7.8 percent since November 3, 2025; in dollars, by 46.9 percent.
- In the 30 days to November 2, 2026, users paid $2.27 billion in fees, of which $1.25 billion stayed with the protocols.
- Dollar stablecoins worth $296.5 billion were in circulation on November 3, 2026, with Tether (USDT) holding 60.2 percent of them.
- Of 2,654 yield pools with at least $1 million in deposits, half paid less than 2.17 percent a year.
What is DefiLlama? The open data platform for DeFi
DefiLlama is an analytics dashboard that has been collecting data on decentralized finance applications since 2020. The platform reads balances directly from the blockchains' smart contracts, converts them into US dollars at market prices and compiles them into rankings. What DeFi is in principle and how lending and exchange protocols work is covered in our guide to decentralized finance.
The core of DefiLlama is open: for each protocol there is a small program, known as an adapter, that defines which contracts are counted. These adapters are public in DefiLlama's adapter repository on GitHub, and anyone can review them and propose corrections. What each metric means is described in DefiLlama's methodology documentation. This openness is why exchanges, analysts and media cite DefiLlama as a reference.
On defillama.com you now find far more than TVL rankings: fees and revenue, trading volume on decentralized exchanges, stablecoins, yields in pools, bridges, funding rounds, token unlocks and a list of known hacks. The API delivers the basic data without a key, and heavy users can buy a paid Pro tier. Our analysis is based on the full dataset of November 3, 2026: 8,919 entries in the protocol list, 427 stablecoins and 15,900 yield pools. We compare further tools for market analysis in our overview of crypto analytics tools and platforms.
TVL on DefiLlama: what total value locked measures
TVL stands for total value locked. It is the dollar value of all coins that users have deposited in a protocol: deposits in lending protocols, liquidity in exchange pools, collateral for stablecoins. TVL is therefore a stock measure. It says how much capital trusts a protocol, but not how much the protocol earns or how often it is used.
The history reflects the market's cycles. In November 2021, DeFi TVL reached $177.5 billion; in October 2023 it fell to $36.0 billion. On November 3, 2025, the statistics showed $144.5 billion, at the start of 2026 still $111.9 billion, and on November 3, 2026, $81.8 billion.
The distribution across blockchains is uneven. Ethereum holds more than half of the capital, followed almost level by Base, Solana, Tron and BNB Chain. Behind them come Bitcoin, the derivatives exchange Hyperliquid's own blockchain, Arbitrum, Robinhood Chain and Monad. How sharp outflows on a single blockchain can be is shown in our analysis DeFi loses 6.7 percent of its ETH deposits.
| Blockchain | TVL in $bn | Share of DeFi TVL |
|---|---|---|
| Ethereum | 43.65 | 53.2% |
| Base | 5.87 | 7.2% |
| Solana | 5.42 | 6.6% |
| Tron | 5.22 | 6.4% |
| BNB Chain | 5.18 | 6.3% |
| Bitcoin | 4.09 | 5.0% |
| Hyperliquid L1 | 2.58 | 3.1% |
| Arbitrum | 1.44 | 1.8% |
| Robinhood Chain | 1.08 | 1.3% |
| Monad | 0.91 | 1.1% |
As of November 3, 2026. Source: DefiLlama. Share of the total across all 290 blockchains with locked capital.
Fees and revenue on DefiLlama: how to read them
DefiLlama separates two metrics that are often confused. Fees are everything users pay to a protocol: trading fees on a decentralized exchange, interest paid by borrowers, and at Lido the staking yield on deposited ether. Revenue is the part that stays with the protocol itself, landing in its treasury or flowing to holders of its token. The rest goes to the liquidity providers, depositors and stakers who supply the capital.
In the 30 days to November 2, 2026, users paid $2.27 billion in fees according to DefiLlama, 15 percent less than in the previous 30 days. Of that, $1.25 billion stayed with the protocols as revenue, just over half. How large the share is depends almost entirely on the business model.
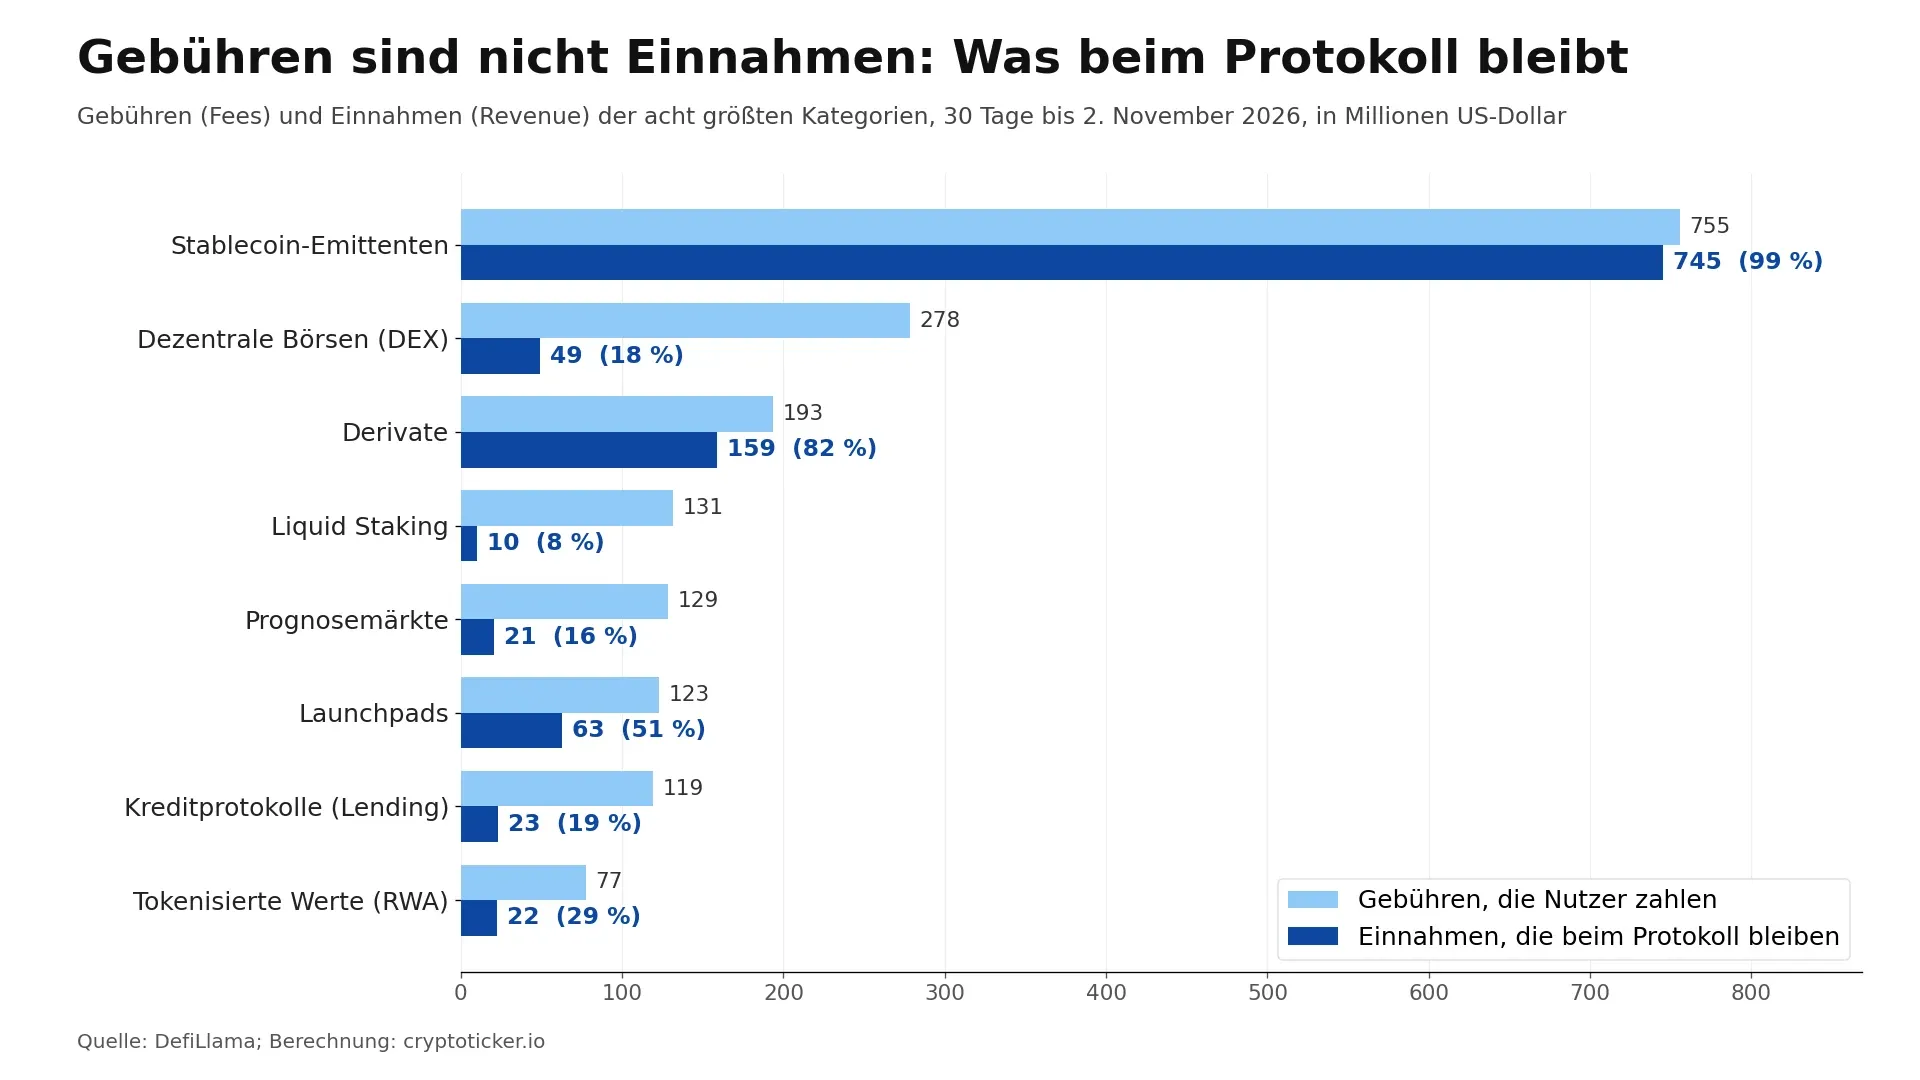
The top of the table is not occupied by DeFi protocols in the narrow sense but by stablecoin issuers. For Tether, DefiLlama counts the interest earned on reserves, mainly short-dated US Treasuries, as fees. Because Tether keeps all of that income, fees and revenue are equal. Lido is the reverse: according to its methodology, Lido keeps 10 percent of staking rewards and passes on the node operators' share from that, leaving about 6 percent as revenue. At Uniswap V4, all trading fees go to liquidity providers; at Uniswap V3, part has flowed into buybacks of the UNI token since December 28, 2025.
| Protocol | Fees, 30 days | Revenue, 30 days | Share retained |
|---|---|---|---|
| Tether (USDT) | $520.4m | $520.4m | 100% |
| Circle (USDC) | $207.8m | $207.8m | 100% |
| Hyperliquid (perpetuals) | $78.6m | $62.0m | 79% |
| pump.fun | $58.7m | $42.3m | 72% |
| Lido | $57.5m | $3.5m | 6% |
| Uniswap V4 | $48.5m | $0.0m | 0% |
| Aave V3 | $36.8m | $4.7m | 13% |
| Uniswap V3 | $34.3m | $8.0m | 23% |
| Sky Lending | $28.4m | $13.4m | 47% |
| Morpho Blue | $24.9m | $0.0m | 0% |
30 days to November 2, 2026. Source: DefiLlama, selection of large protocols.
For investors, revenue is the more important number when it comes to the value of a token. At Hyperliquid, according to its methodology, 99 percent of fees flow into a fund that buys back HYPE tokens; a protocol with high fees and zero revenue, by contrast, earns nothing for its token holders. Revenue is not yet profit, though: DefiLlama does not deduct spending on development, security audits or reward tokens.

Stablecoins on DefiLlama: who dominates the market
In its stablecoin section, DefiLlama shows the circulating supply of every token pegged to a currency, broken down by blockchain. On November 3, 2026, dollar stablecoins worth $296.5 billion were in circulation, 2.5 percent less than a year earlier. Two issuers dominate the market: Tether and Circle together hold 84.2 percent.
| Stablecoin | Supply in $bn | Market share | Backing according to DefiLlama |
|---|---|---|---|
| Tether (USDT) | 178.51 | 60.2% | Fiat and bonds |
| USD Coin (USDC) | 71.26 | 24.0% | Fiat and bonds |
| Sky Dollar (USDS) | 6.49 | 2.2% | Crypto collateral |
| Dai (DAI) | 4.71 | 1.6% | Crypto collateral |
| Ethena USDe | 4.57 | 1.5% | Hedged crypto collateral |
| World Liberty Financial USD (USD1) | 3.88 | 1.3% | Fiat and bonds |
As of November 3, 2026. Source: DefiLlama. Market share of all dollar stablecoins.
Euro stablecoins play a small role in these statistics. All euro tokens combined came to $0.82 billion, 0.28 percent of the total stablecoin market. The largest is Circle's EURC with €502.6 million in circulation, followed by EURCV from Société Générale's subsidiary SG-Forge with €193.1 million. For investors in the EU, authorization also matters: Tether is not authorized under MiCA, and what that means for you is explained in our guide Tether (USDT) explained. Which stablecoins suit which purpose is shown in our stablecoin comparison.
Read circulating supply as a snapshot with a direction: a shrinking supply means more tokens are being redeemed than newly issued. What such a decline looked like for USDC is shown in our analysis USDC shrinks by $4.08 billion.
Yields on DefiLlama: how to find and check returns
The yields section lists returns from pools across all blockchains: deposits in lending protocols, liquidity in exchange pools, staking and vaults. For each pool, DefiLlama shows the annual yield (APY), split into a base yield from interest and fees and a reward paid in the protocol's tokens, plus the pool's TVL and flags for risks such as impermanent loss. On November 3, 2026, DefiLlama listed 15,900 pools, 2,654 of them with at least $1 million in deposits.
Our analysis of these 2,654 pools shows a clear pattern: the higher the yield, the smaller the pool and the more often the return comes from reward tokens rather than real income. 97.8 percent of the capital sits in pools yielding less than 10 percent. Half of all pools paid less than 2.17 percent. The largest single pool, staked ether at Lido with $21.8 billion, returned 2.28 percent.
| Yield (APY) | Number of pools | Total capital | Typical pool size (median) | Share of pools where reward tokens dominate |
|---|---|---|---|---|
| below 5% | 1,849 | $122.56bn | $4.3m | 7% |
| 5 to 10% | 472 | $15.21bn | $4.3m | 15% |
| 10 to 20% | 188 | $2.34bn | $3.2m | 16% |
| 20 to 50% | 108 | $0.67bn | $2.9m | 17% |
| 50% and above | 37 | $0.13bn | $2.3m | 27% |
As of November 3, 2026. Source: DefiLlama, pools with at least $1 million in deposits; calculation: cryptoticker.io.
For stablecoins the picture is calmer. The 327 stablecoin pools with at least $10 million in deposits paid a median of 4.14 percent, of which 3.46 percent was base yield. Higher figures come almost only with leverage, reward tokens or less proven protocols; how quickly such a loop turns negative we work through in sUSDe yield versus Aave borrowing rate. If you are looking for staking through a regulated provider, you will find terms and licenses in our comparison of the best staking platforms.

Six reading mistakes on DefiLlama and how to avoid them
DefiLlama measures carefully, but each number answers only a specific question. These six mix-ups are the ones we come across most often in discussions and price analyses.
1. Mistaking price losses for outflows
TVL is stated in US dollars. If the ether price falls, TVL drops even when not a single coin leaves the protocol. Our calculation for Ethereum: on November 3, 2025 it held $82.1 billion; on November 3, 2026, $43.6 billion, a decline of 46.9 percent. Over the same period the ether price fell from $3,909 to $2,250. Measured in ether, locked capital fell only from 21.0 to 19.4 million ETH, or 7.8 percent. Most of the decline was a price loss, not a loss of confidence.
2. Adding protocol values into one total
Many deposits are passed on several times: ether is staked at Lido, the staked ether serves as collateral at Aave, and the stablecoin borrowed against it ends up in the next pool. If you add up the individual values of all protocols on Ethereum, you arrive at $144.6 billion. DefiLlama reports $43.6 billion for Ethereum, because the total excludes liquid staking at $39.5 billion, bridges at $25.4 billion, staking pools at $12.9 billion, restaking at $5.8 billion and double-counted deposits. You can toggle such items on in the settings; the default view avoids double counting.
3. Confusing exchange reserves with DeFi
DefiLlama also tracks the reserves of centralized exchanges so that investors can check their holdings. In the raw API list, Binance shows $124.8 billion, more than the entire DeFi market at $81.8 billion. These amounts are customer funds on an exchange, not DeFi capital, and do not belong in the DeFi total. DefiLlama therefore lists them in a separate overview.
4. Mistaking fees for profit
High fees show usage, but not what reaches a token. Uniswap V4 generated $48.5 million in fees over 30 days, and the protocol kept nothing as revenue. With tokens, always look at revenue and, on DefiLlama, also at the part that goes to token holders.
5. High yields with no source
We found yields of 50 percent or more in only 37 of 2,654 larger pools, with $0.13 billion in deposits between them. In more than a quarter of those, most of the yield consisted of reward tokens whose price can fall. Always check how much base yield remains, how large the pool is and how long the protocol has existed. What to do with your deposits after an attack on a protocol is covered in our report on the governance attack on Hifi Finance.
6. Confusing TVL with market value
TVL measures deposits in a protocol; market value measures what all tokens of a blockchain or protocol cost on the market. The two are only loosely related. Cardano is an extreme example: on October 20, 2026, $62 million in DeFi stood against a market value of $8.15 billion, and on November 3 DefiLlama counted only $52.8 million. The context is in our analysis Cardano's DeFi versus its market value. DefiLlama shows the ratio of the two directly on many protocol pages.
How to use DefiLlama in six steps
- Check the big picture: the home page shows total DeFi TVL and the protocol ranking. Set the period to one year to separate trends from daily swings.
- Choose a blockchain: the blockchain overview shows where the capital sits and which protocols lead on each blockchain.
- Read the protocol page: it contains the TVL history, fees, revenue, token metrics, security audits and a link to the methodology. Compare the TVL history with the price of the main coin to avoid mistake number 1.
- Compare fees and revenue: the fees and revenue rankings show which protocols are really used and which of them keep something.
- Track stablecoins: if supply grows, new money is flowing into the crypto market; if it shrinks, tokens are being redeemed.
- Filter yields: filter for stablecoins, set a minimum size of a few million dollars and sort by base yield rather than total yield.
If you want to analyze the data yourself, use the DefiLlama API: TVL, fees, stablecoins and yields can be pulled as tables and fed into your own calculations.
DefiLlama for investors: our verdict
DefiLlama is the best free tool for judging DeFi by numbers rather than narratives. The platform is open, fast and covers almost every protocol. Its value only emerges, however, when you read the numbers correctly: think of TVL in coins before dollars, look at revenue rather than fees, and sort yields by where they come from.
Our analysis shows a market that has shrunk sharply in dollar terms but has remained surprisingly stable when measured in coins. Most of the money is earned not by the well-known DeFi protocols but by stablecoin issuers. And large stablecoin pools typically pay around 4 percent a year; anything well above that calls for close scrutiny. If you want to buy coins for DeFi, you will find licensed providers in our comparison of regulated crypto exchanges.
DeFi applications carry technical risks up to a total loss, for example from smart contract bugs or attacks. This guide is not investment advice.
Frequently asked questions about DefiLlama
Transparency note: This article was produced with the assistance of artificial intelligence and reviewed by our editorial team before publication. All figures and claims were checked against the primary sources linked in the text. The feature image was generated with AI.
Related articles
- TOP 5 Blockchains For JUNE 2024
- Cardano has $62 million in DeFi against an $8.15 billion market value: what matters now
- Solana (SOL) Price Prediction For June 2024
- Arbitrum Overtakes The Lightning Network By 23X Crossing $2.6B TVL In 3 Weeks
- DeFi Approaches $6.5 Billion TVL! Here Are The Top 5 Emerging Protocols
Which topics should we dive deeper into?
Select what genuinely interests you. Your picks feed directly into our editorial planning.
Crypto news that's actually worth your time.
Weekly. 60 seconds. Carefully curated by our editors: no hype, no promo flood, no spam.

August 4, 2020 11:32 PM

Top 5 DeFi Coins – DeFi Closes In On $4.5 Billion in TVL!
The relatively nascent, but incredibly growing and highly rewarding field of Decentralized Finance (DeFi) is currently closing in on $4.5B total value locked (TVL). At the time of this writing, the DeFi TVL has reached $4.27B and the biggest DeFi […]
October 23, 2026 10:13 PM

Shiba Inu: $3.0 billion market cap against $46,453 on Shibarium
The Shiba Inu project's own blockchain holds $46,453 on October 23, while the token itself is valued at $2.998 billion. What the figures mean for holders in Germany, and what happens for tax when SHIB is swapped for BONE.

October 12, 2026 1:30 PM

Avalanche climbs 7.2 percent against a falling market: what to watch in the 49 percent rally
Avalanche trades at $11.09 and adds 7.2 percent within 24 hours, while bitcoin, ether and Solana are down over the week. Our own analysis of the chain data shows the capital on Avalanche growing more slowly than the price.
October 10, 2026 4:15 PM

Shiba Inu price prediction: Shibarium's locked capital falls 68 percent, and one pool accounts for it
Shibarium holds only $50,639 on October 10, after $157,958 the day before. The 68 percent collapse goes almost entirely back to one single trading pool. What that means for the Shiba Inu price prediction.
October 13, 2026 7:27 PM
Dogecoin is missing from the new CME index while Chainlink is in, despite being a third larger
Dogecoin trades at $0.0848 on Tuesday afternoon and, at $13.2 billion, is markedly larger than Chainlink. In the new emerging index from CME and CF Benchmarks, Chainlink is in all the same and Dogecoin is not. Why that is, what the usage filter behind it measures, and what follows from it for holders in Germany.
October 8, 2026 10:34 PM

Shiba Inu prediction: Zama's Q2 2026 target window has passed, Shibarium holds $159,561
The price targets for SHIB rest on an upgrade whose target window passed in June. Shibarium today carries $159,561 and 1,323 transactions a day, and that is exactly what the forecast can be checked against.
October 2, 2026 7:26 PM

Shiba Inu price prediction: 1,005 Shibarium transactions today, targets up to $0.0000399
Shibarium has processed 612.8 million transactions since launch, and 1,005 were added this Friday. What that gap means for the Shiba Inu price prediction, which targets the analyst panels name, and what of it touches your tax return.

May 12, 2025 9:05 PM

US-EU Trade Tensions Rise as US-China Conflict Cools Down
Just as the long-standing US-China trade war appears to ease, new tensions are emerging between the United States and the European Union. With Trump calling Europe “nastier than China,” are we about to witness a new transatlantic trade conflict?
November 19, 2024 1:35 PM
MANTRA (OM) Price Prediction: What’s After The 200% Surge?
MANTRA (OM) is trending lately with its latest surge exceeding 200% over the past week, bringing more value to bridging the Old and Modern in finance. Here is how...
July 31, 2023 6:21 PM
Tether Stablecoin Reserves reach a Market Cap Record of $86.5 billion in Q2
Tether, a significant player in the stablecoin market, has recently announced that its reserves have reached an all-time high.
April 8, 2026 11:46 PM

BXB Market Review 2026: Platform, Pricing, and What Traders Should Know
Considering using BXB Market? Here's a detailed look at their platform, account tiers, spread discounts, and trading conditions as of 2026.
June 30, 2026 5:20 PM
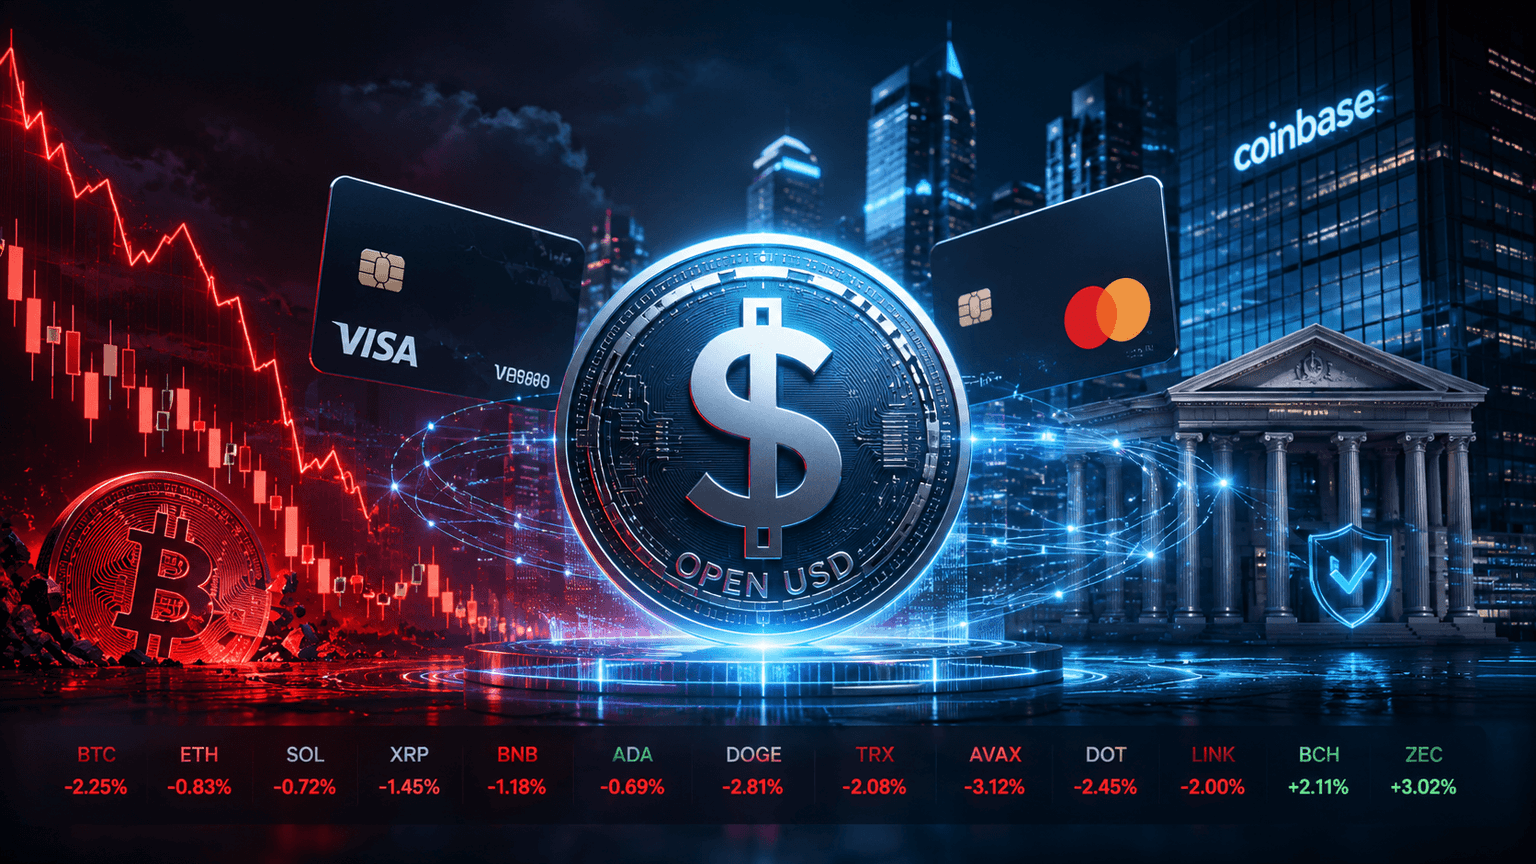
Stablecoin War Begins: Visa, Mastercard and Coinbase Launch Open USD as Bitcoin Crashes
Open USD launches with Visa, Mastercard and Coinbase as Bitcoin falls below $59K. Is this the real crypto story now?
June 24, 2024 10:37 AM

Bitcoin Price Prediction: Can BTC Price Fall Below 50K?
The profitability of Bitcoin futures cash-and-carry trades has plummeted amid a significant crypto market selloff. What are the reasons behind the decline and what can traders expect next?
June 18, 2024 10:15 PM

WHY Is Bitcoin (BTC) DOWN: Top 3 Reasons
Why is Bitcoin (BTC) down, is what everyone is concerned with. After market analysis, here are the top 3 reasons behind it...
July 16, 2026 3:13 PM

Top 5 DeFi Platforms Still Standing in 2026 (And Why They Survived)
DeFi's graveyard is crowded — but these 5 platforms are still alive, thriving, and holding billions in 2026. Here's who made it and why.
March 14, 2026 9:45 AM

War in the Middle East: Stock Market Bleeds $2.4 Trillion While Crypto Gains Ground
The US-Iran war triggers a $2.4T stock market wipeout while crypto gains $250B. Discover why the total crypto market cap is up 5% amid global conflict.
March 10, 2026 6:00 AM

Why Is Crypto So Volatile? 5 Key Factors That Move the Cryptocurrency Market
Why are cryptocurrencies so volatile? Here are 5 key factors that move crypto prices including liquidity, macro news, whales, and investor sentiment.
February 6, 2026 11:00 AM

Top 5 Reasons Why the Crypto Crash is Temporary
The crypto market is facing a sharp correction in early 2026. Here are five data-driven reasons why this crash is a temporary dip rather than a final collapse.
January 14, 2026 2:47 PM

Crypto Markets on Edge on 14 January 2026: US PPI Surprise Ahead of the Tariff Ruling
Hot US producer prices and a pending Supreme Court tariff ruling kept crypto on edge on 14 January 2026. The ruling came on 20 February, and the Fed later raised rates.
June 12, 2025 3:50 PM

GENIUS Act Now in Play: A Turning Point for Crypto Regulation and Stablecoins?
After the U.S. Senate pushed the GENIUS Act closer to becoming law, this groundbreaking crypto legislation could reshape the future of stablecoins, digital assets, and global crypto adoption. But how?
November 12, 2024 1:58 PM

Crypto Market Rally News: EGO and CRO Tokens Lead The Bullish Surge
The global crypto market is on fire, with a 4.25% surge in the last 24 hours. EGO and CRO tokens are among the top performers today. Find out why they are capturing attention in this bullish rally!
September 6, 2024 9:31 PM

XRP Price Analysis As The Ripple Stablecoin Expansion Begins With Japan in Focus
Ripple’s ambitious stablecoin plans in Japan and the current drop in XRP’s price have sparked interest in the crypto world. Will Ripple's global expansion strategy boost XRP price?

August 8, 2023 6:28 AM

How to buy PayPal Stablecoin $PYUSD on Paypal?: Everything You Need To Know
PayPal, has unveiled its stablecoin named PayPal USD (PYUSD). Let's take a look at this PayPal Stablecoin $PYUSD article
October 23, 2026 10:41 AM

Altcoin season explained, 17 of 50 coins beat Bitcoin: what to watch now
An altcoin season is a ratio, not a mood: only when 75 percent of the large coins beat Bitcoin over 90 days does it count as confirmed. We measured the three metrics behind it ourselves and show where they mislead.
October 10, 2026 1:24 PM

TRON (TRX): Polygon Opens Its Payment Stack to $93.44 Billion in USDT: What Matters Now
Polygon opened its Open Money Stack to TRON on October 8: companies can now settle stablecoin payments entirely over the chain. We checked how much USDT really sits there, and show what decides whether it turns into demand for TRX.
September 22, 2026 10:25 PM

Binance Buys Into Circle: What the USDC Deal Means for Your Balance
Binance is taking a $100 million stake in Circle and extending the USDC agreement by five years. For investors in Germany, the sum matters less than the question of who earns money from stablecoins left sitting idle.

More from CryptoTicker