
Stock Market Crash 2026: How Close It Is, What Past Crashes Show and What You Can Do Now
The Nasdaq 100 is 14.7 percent below its record, the DAX only 0.9 percent and Bitcoin almost 40 percent. When people speak of a correction, a bear market and a crash, what the big crashes since 1929 show and what you can sensibly do now.


Which topics should we dive deeper into?
Select what genuinely interests you. Your picks feed directly into our editorial planning.
Crypto news that's actually worth your time.
Weekly. 60 seconds. Carefully curated by our editors: no hype, no promo flood, no spam.
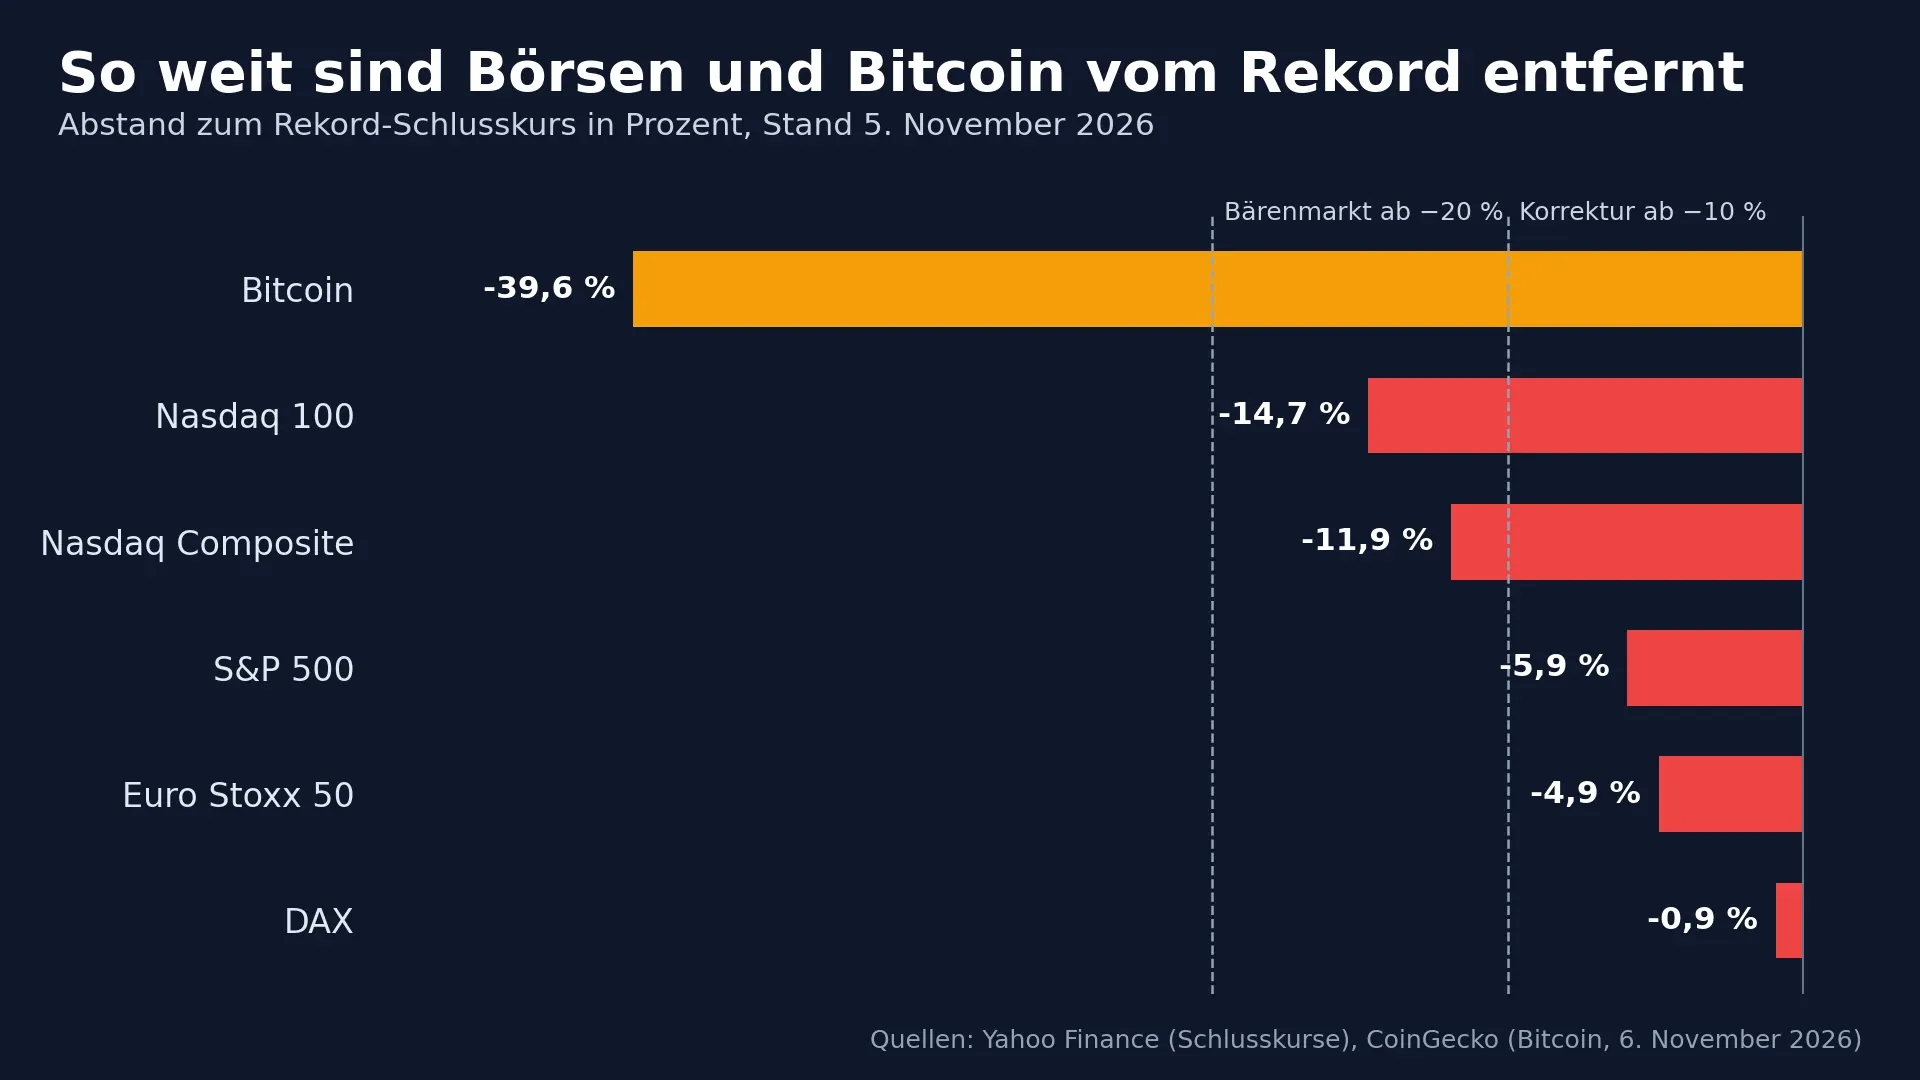
A stock market crash in the strict sense has not arrived in 2026, but a sharp correction is under way on the Nasdaq. The Nasdaq 100 closed at 26,630 points on Thursday, November 5, 14.7 percent below its October 6 record, and lost 6.4 percent on that day alone. The S&P 500 is 5.9 percent below its high, the DAX just 0.9 percent. Crypto is hit hardest: Bitcoin (BTC) stands 39.6 percent below its all-time high.
Here you will find when experts speak of a correction, a bear market and a crash, how close markets are to that threshold, what the big crashes since 1929 show and what you can sensibly do now. Why Bitcoin is falling right now is covered on an ongoing basis in our overview of why cryptocurrencies are falling.
Stock market crash 2026: the key points
- Nasdaq 100: 14.7 percent below the October 6 record, down 6.4 percent on November 5.
- S&P 500: 5.9 percent below its high, down 4.4 percent on November 5.
- DAX: 26,325 points on November 5, 0.9 percent below the August 28 record.
- Bitcoin: 39.6 percent below its all-time high of $126,080 from October 6, 2025.
- VIX fear gauge: 28.2 points on November 5, after 16.6 the day before.
- History: After the 2020 Covid crash the S&P 500 needed six months to reach a new high; after the dotcom bubble the Nasdaq needed 15 years.
Advertisement: Trading stocks, ETFs and crypto: XTB is regulated in the EU. Investing involves risk. Our broker comparison shows more providers.
What is a stock market crash, and when does it become a bear market?
A stock market crash is a very sharp fall in prices in a short time, usually within days or a few weeks. There is no fixed percentage threshold for it. For the two preliminary stages, however, rules of thumb have become established on the market, measured from the last record:
- Correction: from 10 percent below the high. Corrections happen several times in most decades.
- Bear market: from 20 percent below the high. The term describes a longer phase of falling prices, not a single day. How long bear markets lasted in stocks and Bitcoin is shown in our guide to bear markets.
- Crash: a slump that stands out in speed and depth. The textbook example is October 19, 1987, when the S&P 500 lost 20.5 percent in a single day.
By these rules, the Nasdaq Composite is in a correction at 11.9 percent below its high, the Nasdaq 100 is approaching the bear market threshold at 14.7 percent, and Bitcoin crossed it long ago at almost 40 percent.
How close is the 2026 stock market crash? Where things stood on November 6
That depends on where you look. The correction mainly hits US technology stocks; Europe is holding up so far. Closing prices on November 5 compared with each index's record close of the past two years:
| Market | Level on November 5 | Record | Distance | On November 5 |
|---|---|---|---|---|
| Nasdaq 100 | 26,629.81 | 31,224.47 (October 6, 2026) | −14.7% | −6.4% |
| Nasdaq Composite | 24,315.00 | 27,599.79 (October 6, 2026) | −11.9% | −5.5% |
| S&P 500 | 7,353.73 | 7,818.93 (October 6, 2026) | −5.9% | −4.4% |
| Euro Stoxx 50 | 6,231.54 | 6,551.22 (August 11, 2026) | −4.9% | −0.5% |
| DAX | 26,325.01 | 26,569.99 (August 28, 2026) | −0.9% | −0.4% |
| Bitcoin (dollars) | 76,169 | 126,080 (October 6, 2025) | −39.6% | about −6% |
The table is based on daily closing prices from Yahoo Finance and, for Bitcoin, CoinGecko in the early hours of November 6.

 Compare crypto brokers
Why are stock prices falling so sharply right now?
Because the AI and chip trade is unravelling. After the midterms, investors sold exactly the stocks that had carried the rally since the spring, and because the Nasdaq 100 is heavily concentrated in a few large technology groups, it is falling twice as fast as the broad market. The details of Thursday are in our analysis of the Nasdaq crash.
Three factors add to the pressure:
- Oil: Brent rose 4.7 percent in the 24 hours to 11 p.m. UTC on Thursday, to $99.24 a barrel. Expensive energy keeps inflation high and limits central banks' room for manoeuvre.
- Interest rates: The US Federal Reserve raised its key rate to 3.75 to 4.00 percent in September and held it on October 28, with two members voting for a further increase, according to the Fed statement. High valuations and rising rates do not mix well.
- Politics: The Democrats take over both chambers of Congress in January, and Trump's announced deal with Russia brought no relief because details are lacking.
Whether this turns into an AI bubble that bursts is a scenario we already played through in June; the piece on the AI bubble and its consequences for Bitcoin now carries the November 6 update.
What past stock market crashes show
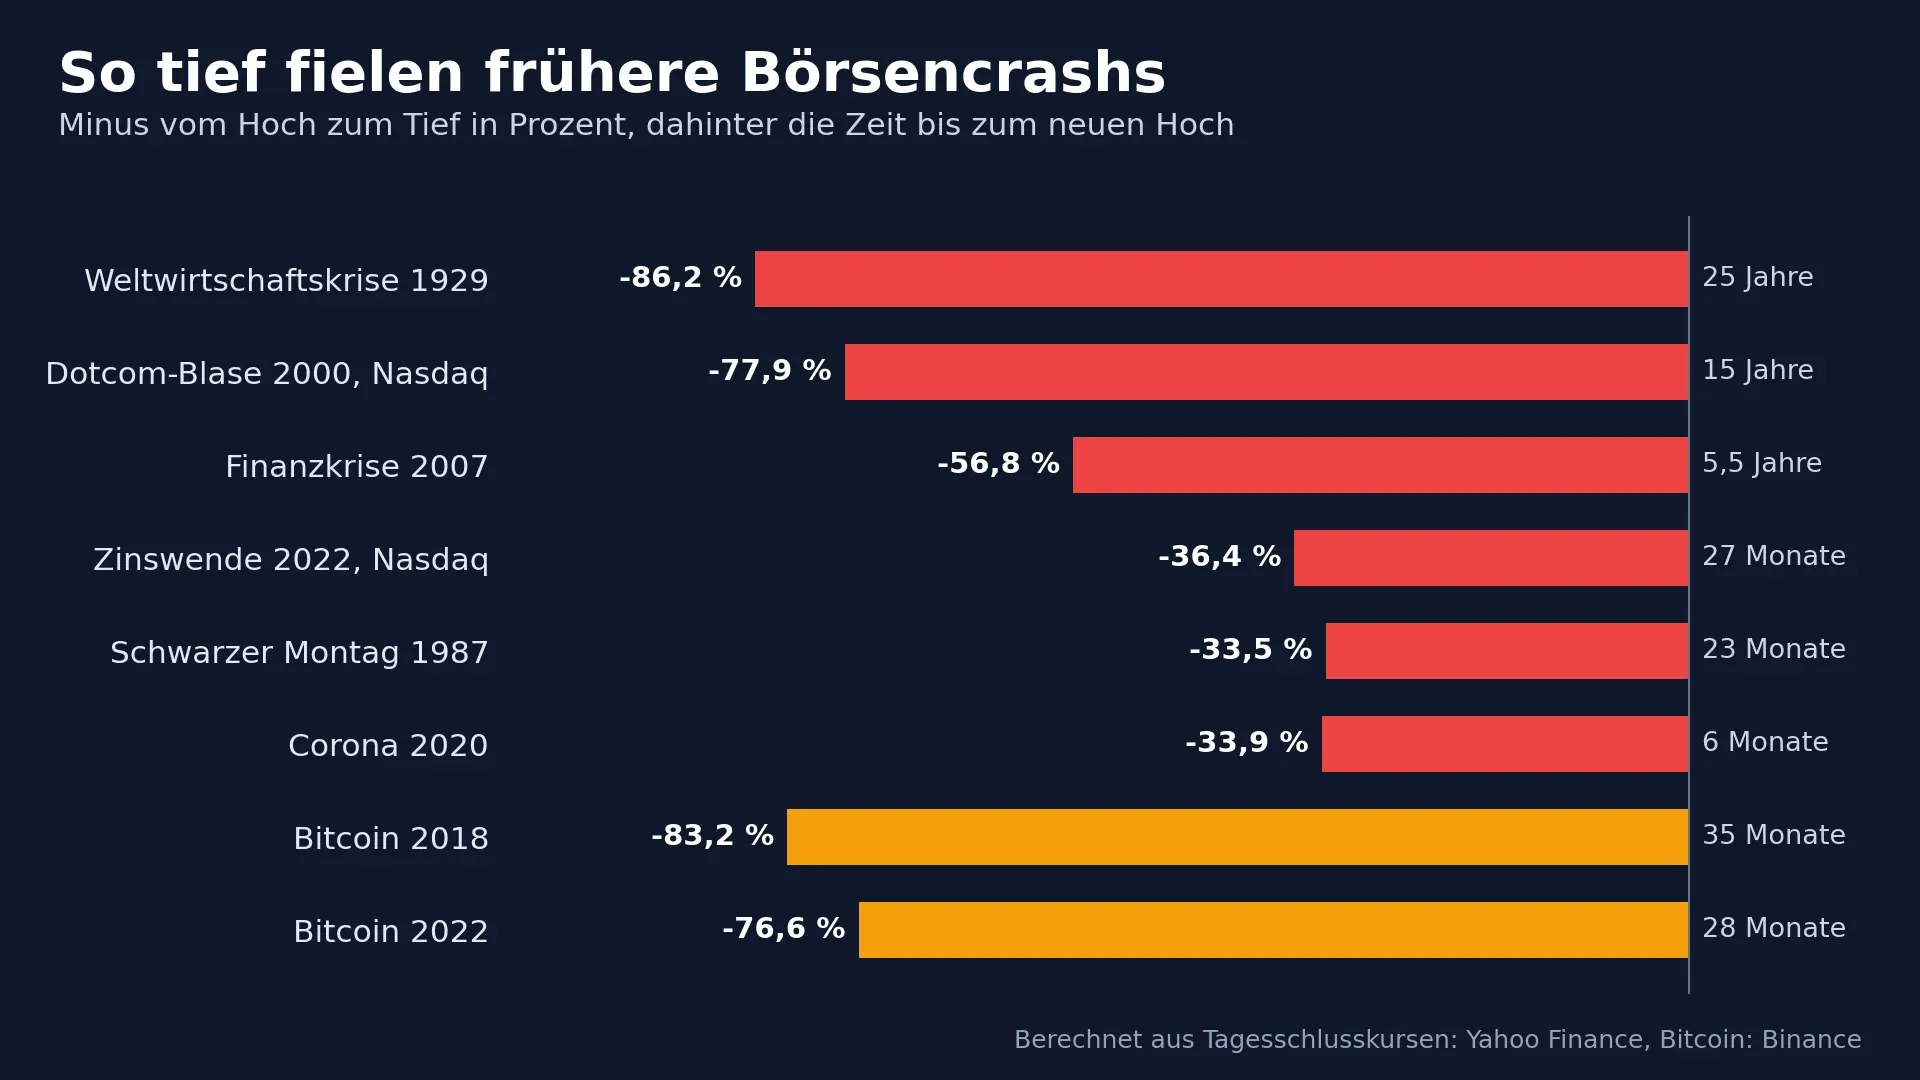
Above all two things: depth varies enormously, and the time to a new high varies even more. The table shows the big slumps, calculated from daily closing prices of the S&P 500 and the Nasdaq Composite, each from the last high to the low and to the first close above the old high:
| Crash | Index | High to low | Decline | Time to new high |
|---|---|---|---|---|
| Great Depression | S&P 500 predecessor | 09/16/1929 to 06/01/1932 | −86.2% | 25 years (September 1954) |
| Black Monday | S&P 500 | 08/25/1987 to 12/04/1987 | −33.5% | 23 months (July 1989) |
| Dotcom bubble | Nasdaq Composite | 03/10/2000 to 10/09/2002 | −77.9% | 15 years (April 2015) |
| Financial crisis | S&P 500 | 10/09/2007 to 03/09/2009 | −56.8% | 5.5 years (March 2013) |
| Covid crash | S&P 500 | 02/19/2020 to 03/23/2020 | −33.9% | 6 months (August 2020) |
| Rate turn | Nasdaq Composite | 11/19/2021 to 12/28/2022 | −36.4% | 27 months (February 2024) |
The causes of the biggest stock market crashes
Each big stock market crash had a different trigger, but the underlying pattern is often the same: investors pay prices that are too high on credit, then sentiment turns, and forced selling accelerates the decline. A brief look at the events behind the table:
- 1929: Many investors had bought shares on credit. When prices fell in October 1929 they had to sell to cover loans, and the crash turned into the Great Depression with bank failures and mass unemployment.
- 1987: On Black Monday, computer-driven selling programs designed to hedge portfolios automatically when prices fell amplified the slump. The central bank then provided liquidity, and the economy did not slide into recession.
- 2000: Internet companies without profits were worth billions on the stock market. When money for new funding dried up, the dotcom bubble burst and the Nasdaq lost almost four fifths of its value.
- 2007 to 2009: Bad US mortgage loans, packaged into securities, sat on banks' balance sheets. With the collapse of Lehman Brothers on September 15, 2008, this became a global financial crisis.
- 2020: The Covid pandemic and lockdowns made equity markets fall by a third in just 23 trading days. Central banks and governments provided trillions in support, and the recovery came faster than ever before.
- 2022: The highest inflation in decades forced central banks into rapid rate hikes. Highly valued technology stocks and cryptocurrencies were hit hardest.
For 2026, the dotcom bubble is the comparison many draw, because then as now technology stocks dominated the market. The difference lies in profits: whether the big AI groups earn back their investment in data centres will decide whether 2026 plays out more like 2000 or like 2020. That is worth watching with every set of quarterly results, more than any headline.
 Find the right exchange for your tokens
What does Bitcoin do in a stock market crash?
So far Bitcoin has fallen along with stocks in a crash, often even harder. On November 5 Bitcoin lost 6.2 percent in 24 hours, almost as much as Nasdaq 100 futures at 6.9 percent. In the Covid crash, Bitcoin fell 39.5 percent in a single day on March 12, 2020, measured by the closing price on Binance. Bitcoin's own bear markets were deeper than almost any stock market crash: down 83.2 percent to December 2018 and down 76.6 percent to November 2022, with the new high coming after 35 and 28 months respectively.
The reason is liquidity. When investors have to cover losses or service loans on the stock market, they sell whatever can be sold around the clock, and Bitcoin trades at night and at weekends too. How deep it can go and which levels matter now is set out in our analysis of the Bitcoin crash.
What you can do in a stock market crash
The most important decision comes before the sell button. These five points help you stay calm without betting on a direction:
- Check your reserve: Money you need in the next two years does not belong in stocks or crypto. If you have that reserve, you do not have to sell in a crash.
- Keep savings plans running: A savings plan automatically buys more units when prices fall. After the crashes of 2020 and 2022, exactly that captured the recovery.
- Use diversification: The gap between the Nasdaq 100 and the DAX shows what diversifying across regions and sectors achieves. If you hold only US technology, you carry the full concentration risk.
- Know your leverage: If you trade with leverage, you should know at which price a position will be forcibly closed. How hedging with short positions works is explained in our guide to shorting in falling markets.
- Consider tax: In Germany, gains on shares are subject to withholding tax, and losses on shares can only be offset against gains on shares. With crypto, a gain is tax-free after a holding period of one year; if you sell earlier and reach gains of 1,000 euros or more in the year, you pay your personal tax rate on the entire gain. What a sale costs is shown by the CryptoTicker tax calculator.
If you want to buy into the pullback, you will find providers for stocks and crypto in our comparison of the best crypto brokers and all the ways to buy Bitcoin. Larger crypto amounts belong on a device from our hardware wallet comparison.
Typical mistakes in a stock market crash: panic, stop-loss and timing
The biggest losses in a crash often come not from the decline itself but from decisions driven by fear. We see three mistakes in every crisis:
- Selling at the bottom: Selling after a 30 percent slump makes the loss final. The table above shows that the broad market has so far recovered from every crash, even if that sometimes took years.
- Setting a stop-loss badly: A stop-loss is an order that automatically sells a position once a price is reached. In a crash, however, prices often jump past the level, and the sale is executed well below the plan. If you use a stop-loss, set it at a distance from round numbers and be aware that it does not protect you in price gaps.
- Trying to guess the bottom: Nobody reliably hits the lowest point. A strategy that buys in instalments over weeks takes this decision off your hands and spreads the risk over several prices.
For investing, that means a portfolio that matches your time horizon is the best protection. If you will not need your money for ten years, you can sit out a crash and use it through savings plans. If you need it in a year, you should not hold it in stocks or crypto in the first place.
How likely is a stock market crash in 2026?
A crash cannot be predicted, but how nervous the market is can be measured. Three figures show whether the correction is turning into something more:
- The distance from the high: If the S&P 500 falls more than 20 percent below its high of 7,818.93 points, that is below roughly 6,255 points, the broad US market is in a bear market.
- The VIX fear gauge: It rose from 16.6 to 28.2 points on November 5. During the tariff shock in April 2025 it closed at 52.3 points.
- AI groups' profits: As long as revenue and profits support the investment, a pullback remains a pullback.
Our assessment: the situation is serious for the technology sector, but not yet for the broad market. If you hold the German market in your portfolio, the DAX is close to its record. The dates that matter now and the latest state of play are in our analyses, which we update with every big move.
As of November 6, 2026, 2 a.m. This article is not investment or tax advice; stocks and crypto assets can lose a great deal of value.
Frequently asked questions about the 2026 stock market crash
Transparency note: This article was produced with the assistance of artificial intelligence and reviewed by our editorial team before publication. All figures and claims were checked against the primary sources linked in the text. The feature image was generated with AI.
Related articles
- Bitcoin Price Prediction 2030: Targets From $500,000 to $2.4 Million Put to the Test
- Will Bitcoin Go Back Up? Three Scenarios to Year-End: $70,000, $80,000 or $100,000
- Coin of the future: Which cryptocurrency should you buy for 2030?
- Crypto Crash: Why Bitcoin, Ethereum, XRP and Solana Fell This Week and What Comes Next
- Crypto market cap explained: Bitcoin vs gold and Apple
Which topics should we dive deeper into?
Select what genuinely interests you. Your picks feed directly into our editorial planning.
Crypto news that's actually worth your time.
Weekly. 60 seconds. Carefully curated by our editors: no hype, no promo flood, no spam.

November 6, 2026 5:32 AM

Bear market: what it means, how long it lasts and where stocks and Bitcoin stand in 2026
Bitcoin has been in a bear market since November 2025, and the Nasdaq 100 is closing in on the threshold. What a bear market is, how long it lasts on average, how to spot its end and what you can do now, worked out from 27 S&P 500 bear markets since 1928.
November 5, 2026 5:54 PM

Nasdaq Crash: Chip Stocks Fall Up to 11% and Drag Bitcoin Down With Them
The Nasdaq slid into a correction as chip and AI stocks sold off after the midterms, and Bitcoin (BTC) went down with them. What triggered the rout, who lost most, and why crypto is tied to the AI trade.

November 5, 2026 5:13 PM

Bitcoin falls below $77,000 as a Nasdaq chip sell-off sets off a liquidation wave
Bitcoin (BTC) dropped from $78,767 to $75,986 within an hour on November 5, and Ether lost more than 6 percent. A sell-off in chip stocks on the Nasdaq set it off, and forced liquidations of more than $560 million deepened the slide.
November 3, 2026 10:36 PM

Anthropic Stock: How to Buy, IPO Date and Pre-IPO via XTB
Anthropic plans to list on Nasdaq under the ticker ANT. When you can buy the stock, what the pre-IPO CFD at XTB is, how the offers in Europe and the UK work and what the prospectus says.

November 3, 2026 8:28 AM

Why Is Crypto Down Today? The 5 Reasons Behind the November 3 Sell-Off
Why is crypto down today? Bitcoin sits near $76,000 after the Binance hack, a hawkish Fed and a Nasdaq slide. The five drivers, explained.
October 31, 2026 12:48 AM

Crypto Weekly Recap: Binance Hack, Wall Street Crash and Gold Under Pressure
The largest crypto theft in history, Wall Street's worst day since June and a Fed that turns hawkish: week 44 of 2026 in numbers, the five events that mattered, winners and losers among the top coins and what crypto investors should watch next week.
October 31, 2026 12:36 AM

Binance Hack, Then a Stock Market Crash: Coincidence or Connection?
The largest crypto theft in history on Thursday evening, Wall Street's worst day since June on Friday. Are the Binance hack and the stock market crash connected? Our analysis of timeline, sizes and money flows, and where crypto and stocks really meet.
October 31, 2026 12:02 AM

Stock Market Crash: Why US Stocks Now Swing Like Meme Tokens
Intel and Reddit lost 29 percent in a single day, almost twice as much as Bitcoin on its worst day since 2020. The Nasdaq had its worst day since June. The triggers of the stock market crash, why US stocks now move like crypto tokens and what comes next week.
October 29, 2026 9:49 PM

Is This the End? How Low Bitcoin Could Fall After the Binance Hack
About $2.8 billion left a Binance hot wallet and Bitcoin slid below $79,000. Whether this turns into a real crash depends on one question. Three scenarios, the key price levels for Bitcoin, Ethereum and Solana and what to do now.
October 29, 2026 9:45 PM

How to Short Bitcoin in the Crash: Step by Step on Bitget and OKX
Bitcoin fell below $79,000 after the Binance hack. If you want to bet on falling prices or hedge, a short does exactly that. How it works on Bitget and, for EU readers, on OKX Europe, a worked example at tonight's price and the risks of shorting after a crash.
October 29, 2026 9:08 PM

Best Crypto to Buy Now: 5 Coins to Watch in November 2026
The best crypto to buy now, updated every month: five coins for November 2026 with price, catalyst and main risk, how we pick them and how last month's list performed.
October 27, 2026 5:23 PM

China AI Bubble Bursts: $480 Billion Gone, So Why Is Bitcoin Not Crashing?
China’s AI stock bubble has burst, erasing $480 billion as the STAR50 drops 40%. Here is why it happened and what it means for Bitcoin and crypto.
October 25, 2026 10:51 AM

Crypto Crash: Why the Top Cryptos Lost Up to 4% in One Week
Crypto crash week: the largest cryptos lost up to 4% in seven days. We break down why crypto prices are falling and what to watch next.
October 22, 2026 10:33 AM

Bitcoin crash history: every fall of more than 50 percent since 2011
Analysis: seven times since 2011 Bitcoin has lost more than half its value, most recently 53 percent to June 2026. Every crash with its high, low, duration and recovery, the triggers from Mt.Gox to the tariff liquidations, and what investors can take from them.
October 20, 2026 10:38 AM
Crypto Crash Today: Why Is Bitcoin Stuck Below $82,000?
Bitcoin can't hold $82K, Ethereum is down 20% in 2026 and ETF money keeps leaving. Here is what is really behind the crypto crash today.
October 16, 2026 1:41 AM

Bitcoin Rainbow Chart: the middle of the colour bands sits at $140,000, the price at $82,000
The Bitcoin Rainbow Chart places the price in nine colour bands around a logarithmic regression. What the bands show today, where the model comes from and the point at which it has been wrong for years.
October 8, 2026 5:06 PM

Crypto Crash Reason: Why Bitcoin Fell Below $81,000 and Altcoins Bled Even Harder
Bitcoin slid under $81,000 and Ethereum lost 9% in a week. Here is every crypto crash reason behind the October 2026 selloff explained.
October 8, 2026 4:38 AM

Crypto Market Slides: Bitcoin Loses 4.2 Percent and $651 Million of Long Bets Are Liquidated
Bitcoin has lost 4.2 percent since Tuesday afternoon, and ether and XRP more still. Three reasons can be documented: outflows from the US ETFs, $651 million of forcibly closed long bets and Fed minutes holding out the prospect of another rate rise. A crash it is not, and what to check before buying more is set out here.
September 29, 2026 10:38 AM

Bitcoin Falls Toward $83,000 as Trump Rejects Iran Ceasefire Deal
Bitcoin slipped toward $83,000 after Trump rejected Iran's Hormuz proposal, sending oil above $100 and wiping out $478 million in crypto liquidations.
September 14, 2026 10:11 PM

Revolut Data Breach: Your Files Are Public, and Here Is What You Can Do
Since September 14, the ID copies, KYC selfies and account statements stolen from Revolut have been published. What a password change no longer achieves, which rights the GDPR gives you, and why your Bitcoin history is the most sensitive part of the package.
July 30, 2026 3:31 PM

What Is the KOSPI? Inside the $2 Trillion Crash Shaking Global Markets
The KOSPI has erased around $2 trillion in 40 days, its worst crash on record. Here is what happened, why it matters and what it means for crypto.
July 28, 2026 11:53 AM

Why Is Crypto Down Today? The Reasons Behind Every Crypto Sell-Off
Why crypto is falling today, updated with every major move: the current trigger, the six forces behind almost every crypto sell-off, a five-minute checklist and a timeline of the 2026 drops.
July 17, 2026 3:24 PM

$1 Trillion Wiped From US Stocks at Open as Iran Strikes US Bases — Is Crypto Next?
US equities shed ~$1T at the open as Iran hits US bases across the Gulf. Oil is surging, Bitcoin already slipped — here's what it means for crypto.
June 8, 2026 10:50 AM

Is it Time to Buy the Crypto Dip? Bitcoin at $60k Amid Middle East Escalation
Bitcoin has plunged from $120k to $60k as Middle East geopolitical tensions spike. Explore whether to buy the crypto dip or wait for further downside.


More from CryptoTicker