
Is Dogecoin a Good Buy at Current Prices?
Dogecoin has recovered roughly a third off its twelve-month low and is testing its 200-day average. What the chart, RSI and supply mechanics mean for an entry now. What speaks for buying at the current price — and what against it.





Which topics should we dive deeper into?
Select what genuinely interests you. Your picks feed directly into our editorial planning.
Crypto news that's actually worth your time.
Weekly. 60 seconds. Carefully curated by our editors: no hype, no promo flood, no spam.
Dogecoin trades at around 0.0930 US dollars on 4 October 2026, some 65.1 percent below the twelve-month high of 0.2668 US dollars from 7 October 2025 and 34.8 percent above the twelve-month low of 0.0690 US dollars set on 7 August 2026. Anyone buying today is buying after a recovery of roughly a third off the summer low. Is Dogecoin a good buy at current prices, or is this a counter-move that has already had its best weeks?
cryptoticker.io collected the price data for this analysis on 4 October 2026. The source is CoinGecko, and we evaluated the daily closing prices of the past 365 trading days. The metrics are calculated with standard formulas: exponential moving averages over 200 and over 50 days, the RSI according to Wilder over 14 periods, and volume averages as the arithmetic mean of daily turnover. All figures refer to that date. Our longer-term view is set out separately in our Dogecoin price prediction.
Dogecoin Price Analysis: Where the DOGE Price Stands in October 2026
Dogecoin carries a market capitalisation of roughly 14.5 billion US dollars on a circulating supply of about 156.2 billion DOGE, which places it twelfth among all crypto assets by market value. The fall in price has not pushed it into obscurity.
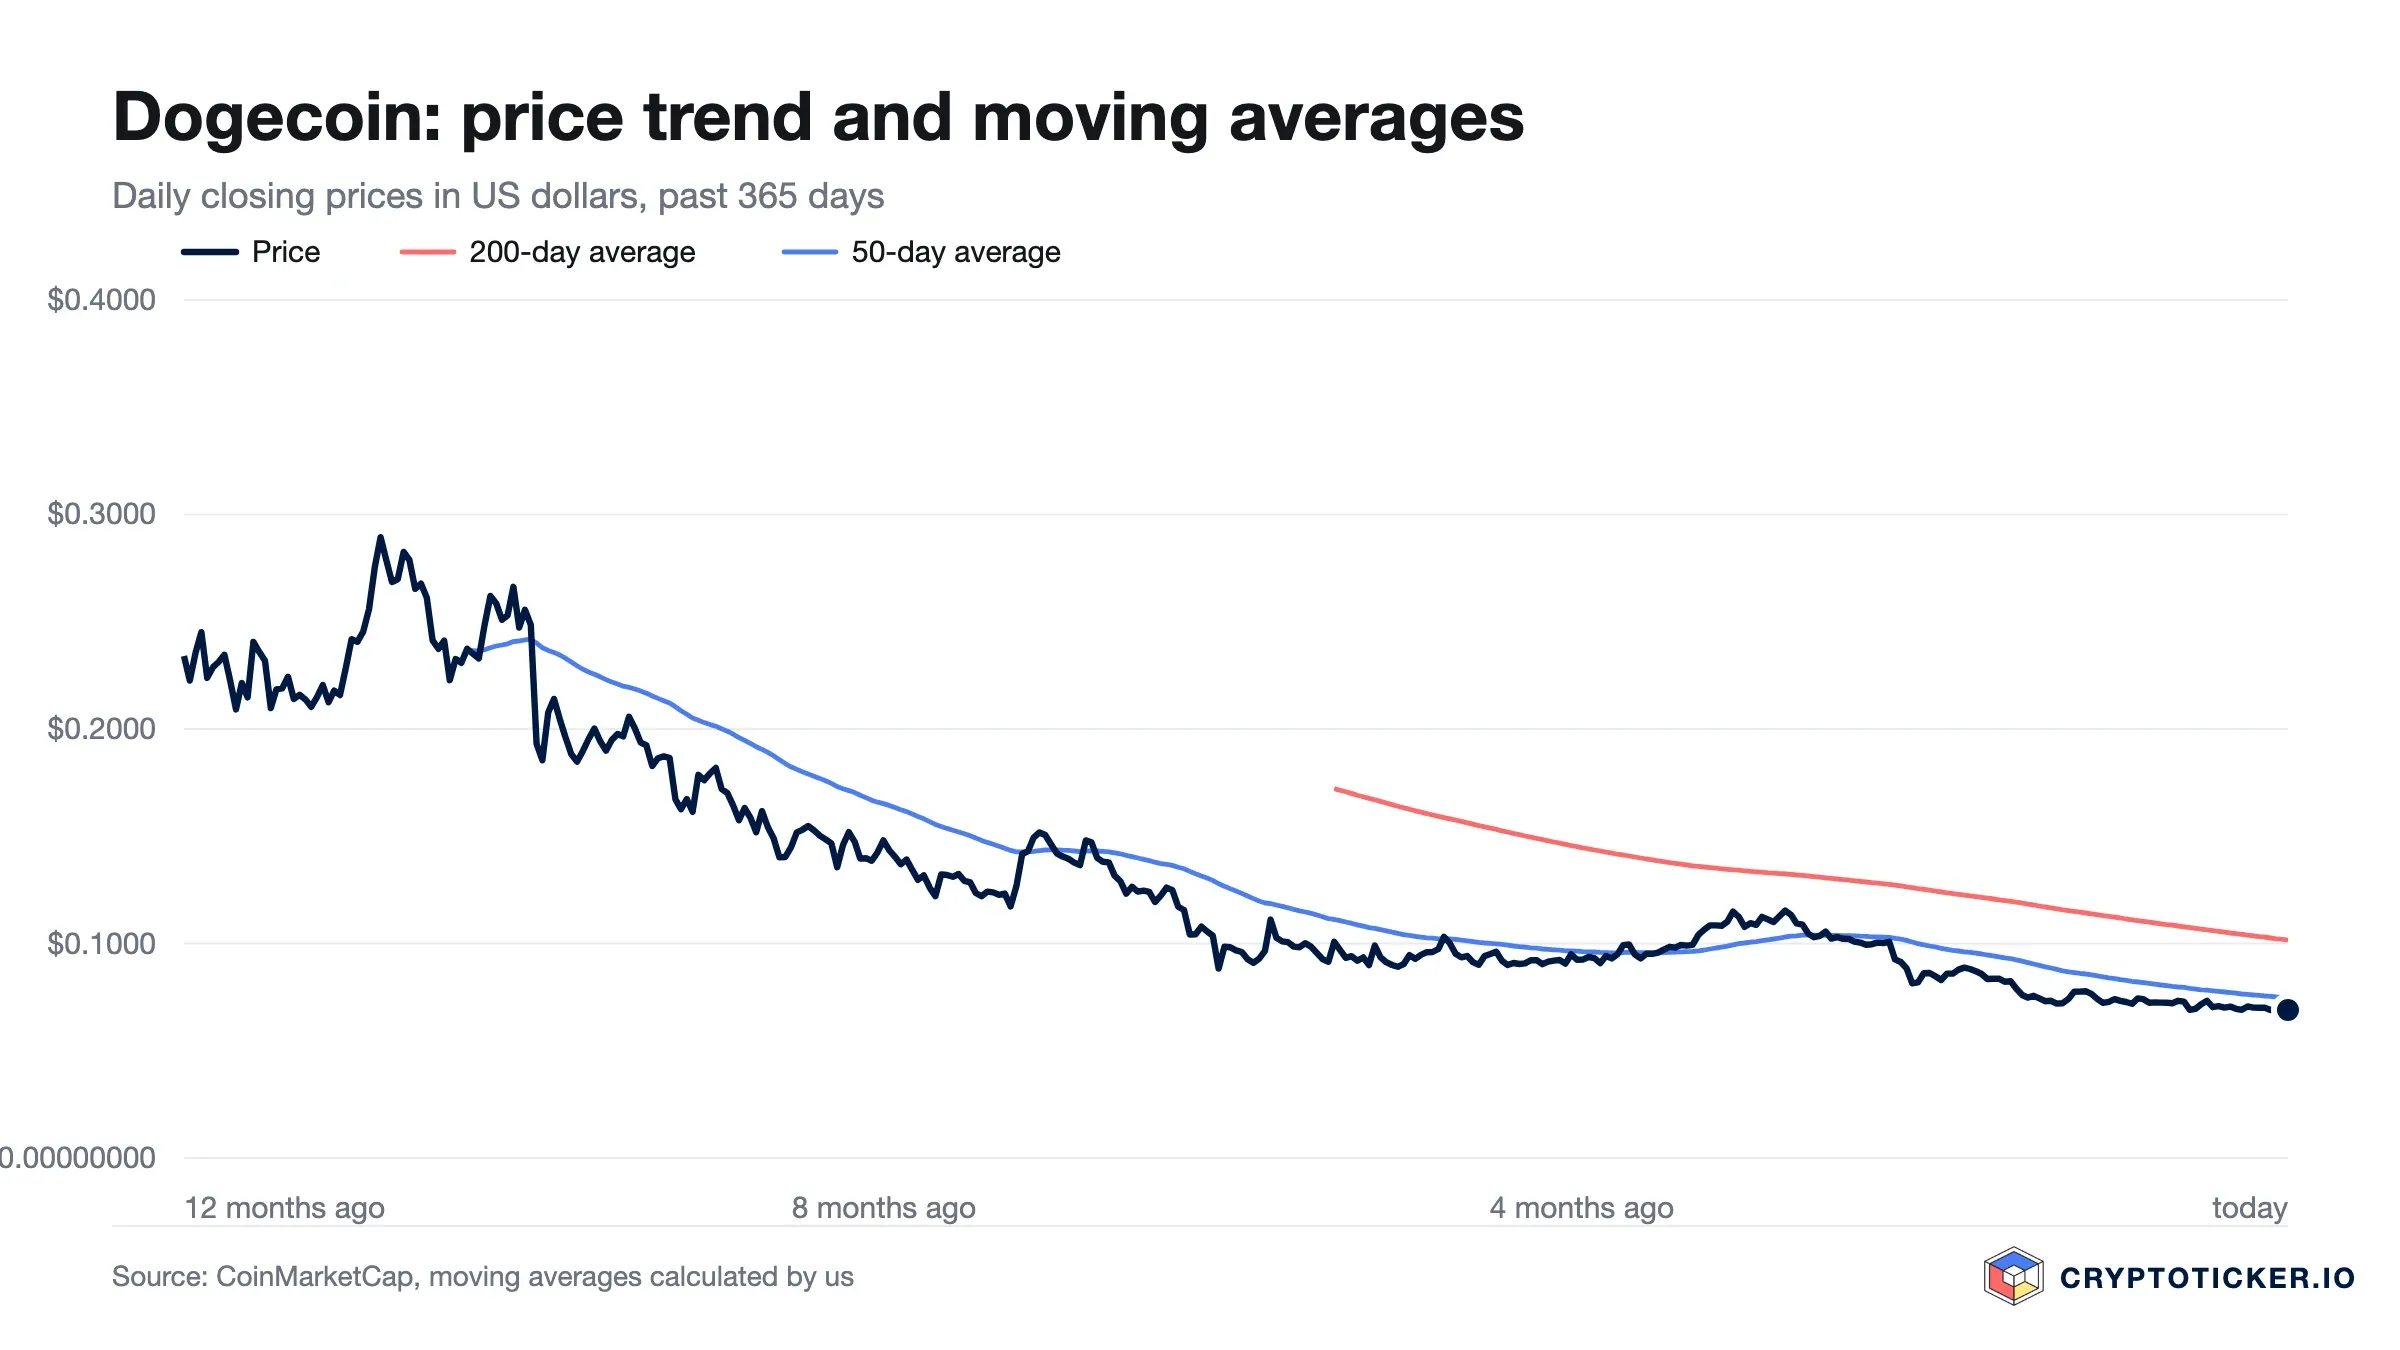
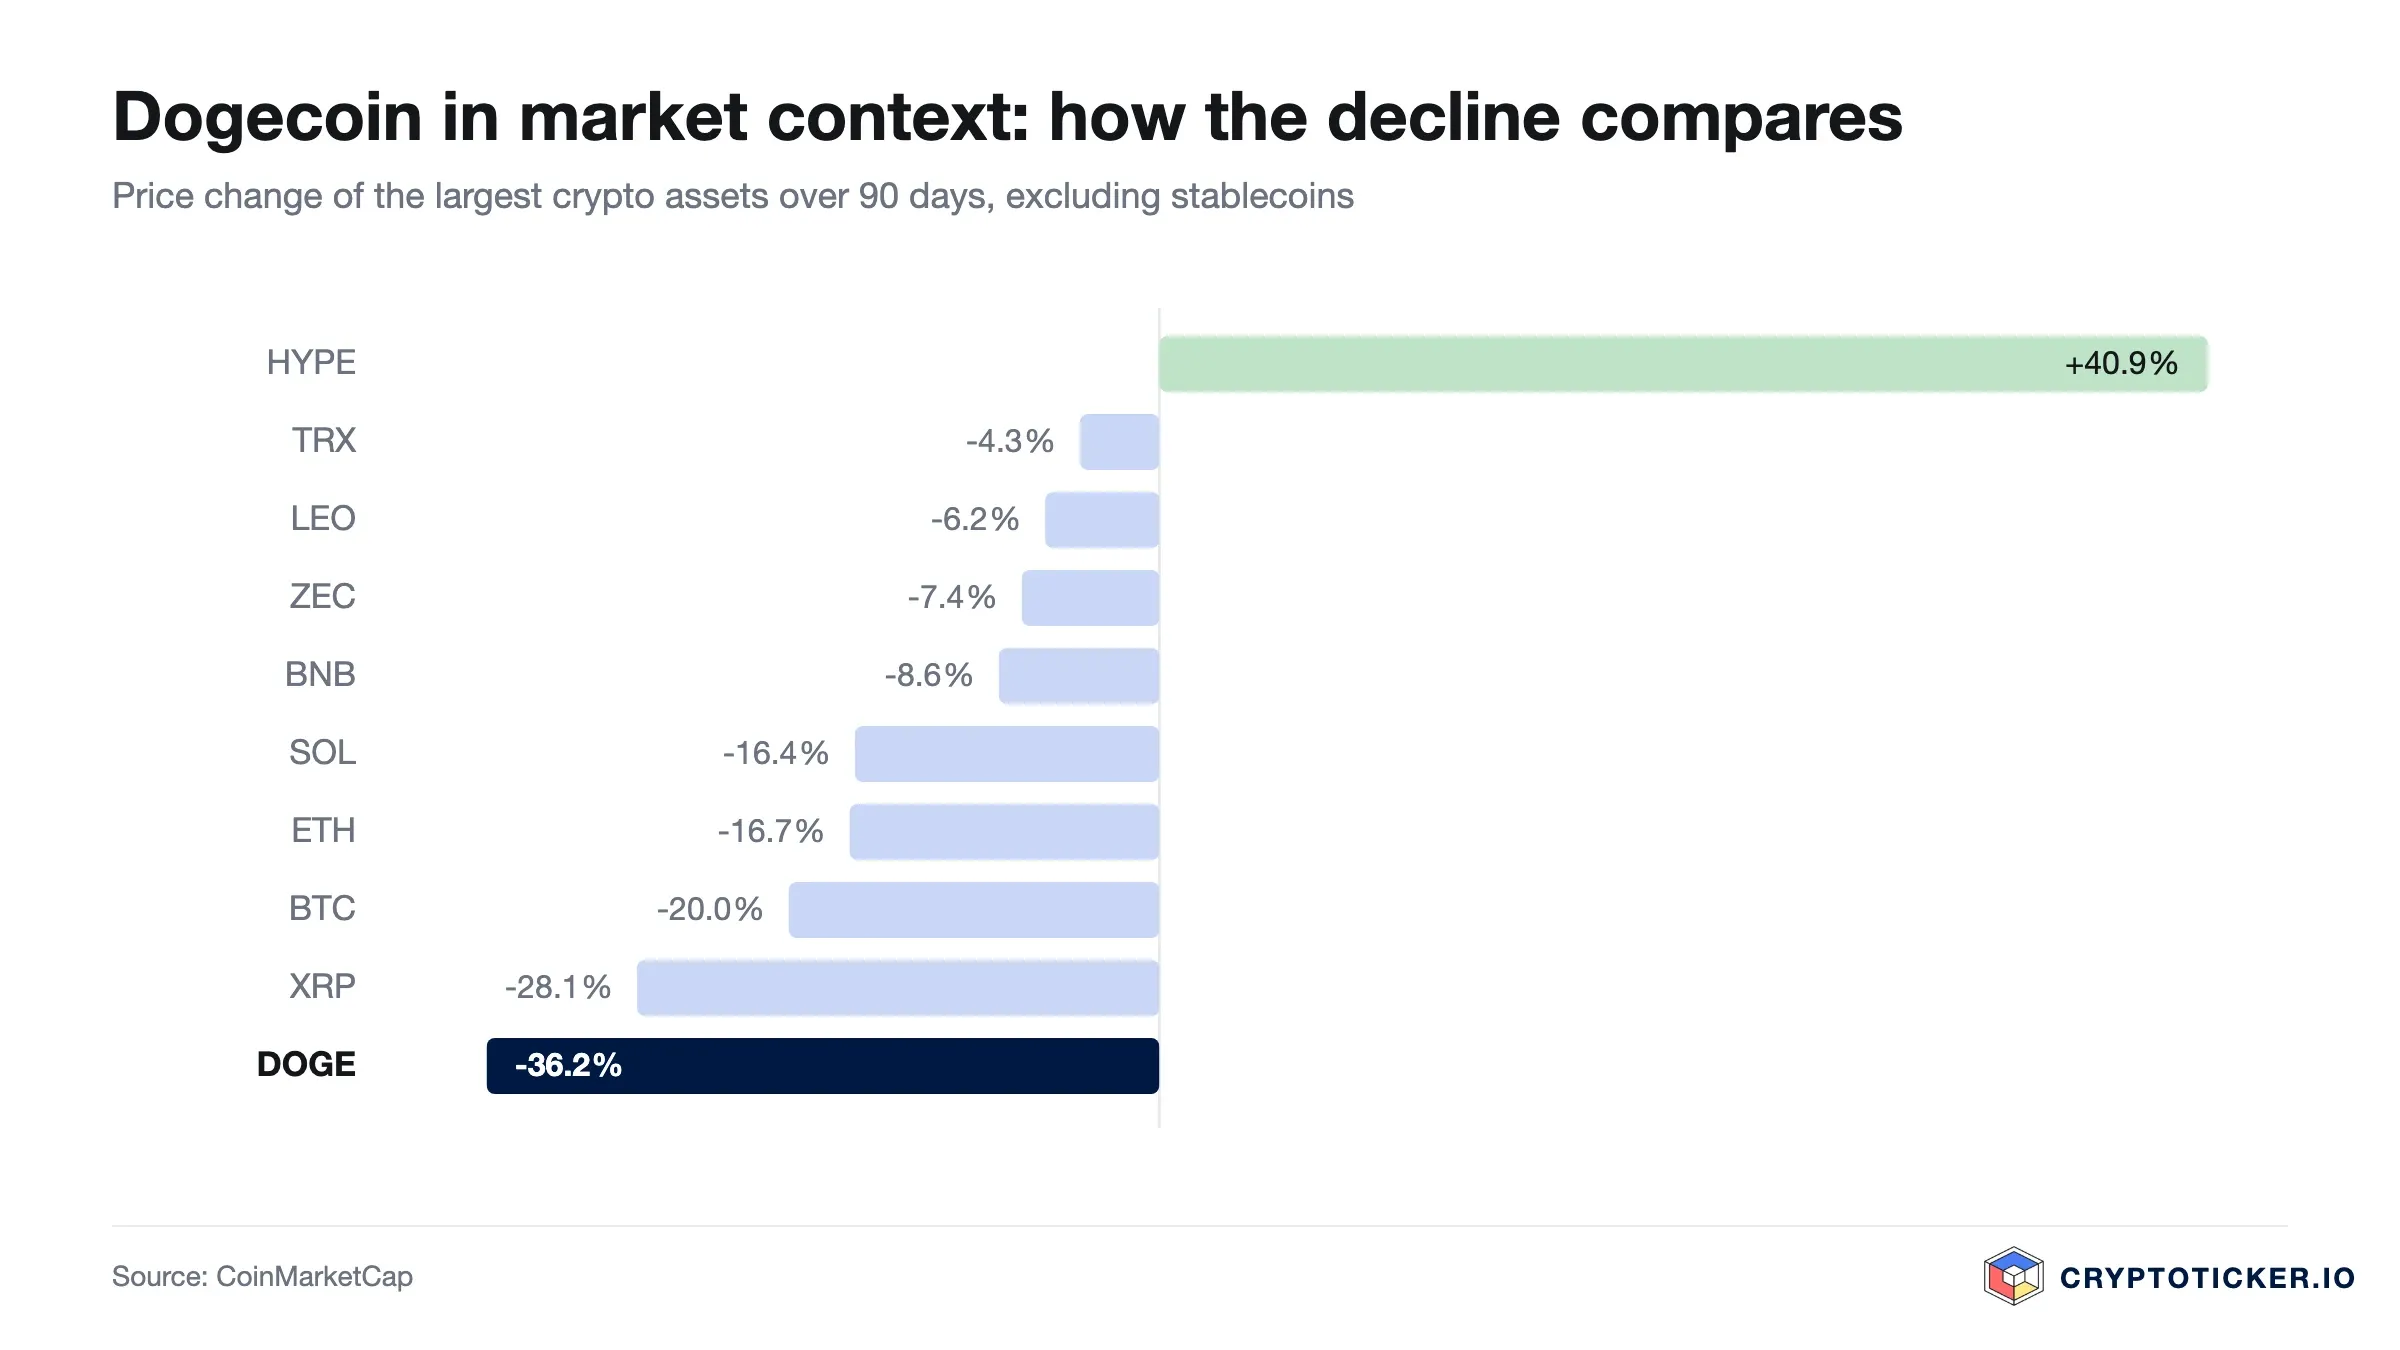
The chart has two speeds. Over twelve months the price is still down roughly 63 percent, from about 0.2510 US dollars to 0.0930 US dollars today. Over 90 days, however, the price has gained 21.5 percent, over 30 days 9.7 percent, and over the past week it has given back 3.9 percent. A steep annual decline has turned into a recovery that is now pausing.
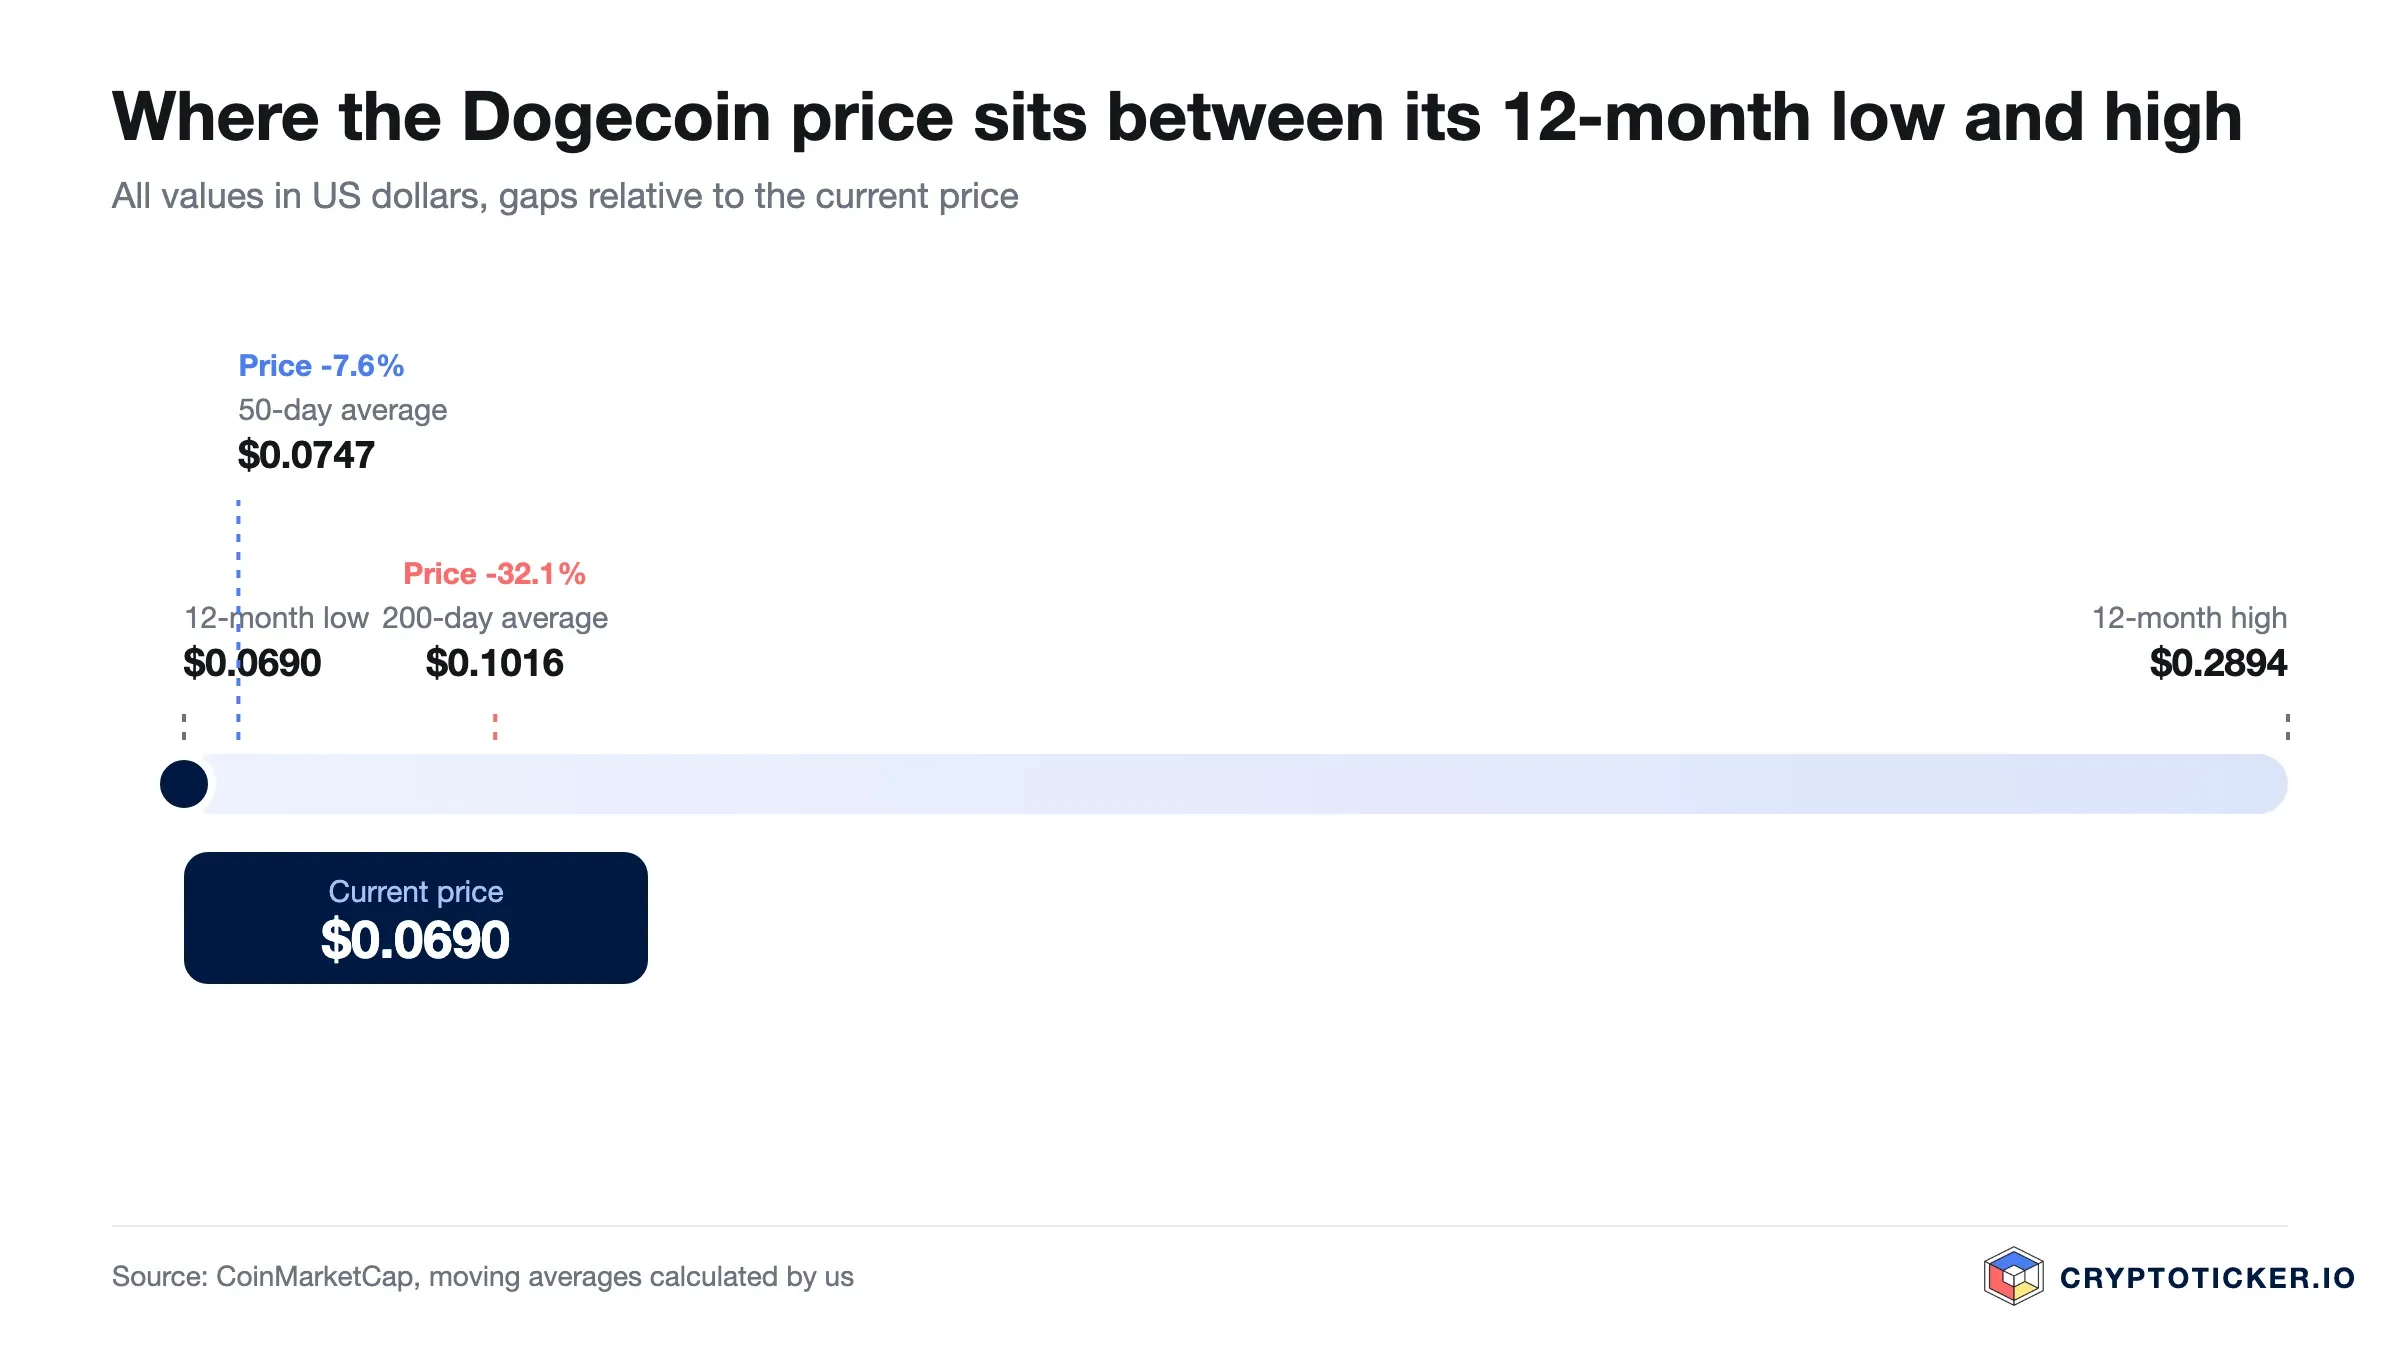
Three levels define the picture. The twelve-month low of 0.0690 US dollars from 7 August 2026 now sits 34.8 percent beneath the market. The 50-day exponential moving average at 0.0878 US dollars has flipped from resistance to support and runs 6.0 percent below spot. Above both stands the 200-day exponential moving average at 0.0940 US dollars, just 1.0 percent above the current price and the level the market would have to reclaim before the annual downtrend could be considered over.
Is the Dogecoin Downtrend Broken or Merely Interrupted?
A downtrend is broken when a market stops making lower lows and reclaims the averages it has traded beneath. Dogecoin now meets the first condition and half of the second. The low of 0.0690 US dollars on 7 August 2026 remains the weakest print of the twelve-month window and has not been retested since, and the 50-day average has been reclaimed; the 200-day average has not.
What has changed is the direction. Between May and July the price gave up more than a third of its value; since the August low it has added roughly a third back. The seven-day loss of 3.9 percent shows a market taking a breather inside that recovery rather than one resuming its fall.
The 200-day exponential moving average at 0.0940 US dollars is now the level that decides which of the two readings is correct. The price currently sits about 1 percent below it. As long as Dogecoin trades under that line, every rally remains a move within a falling market. A weekly close above 0.0940 US dollars would be the first technical evidence that the recovery is turning into a trend change, and holding that line for several weeks would be the confirmation.
What RSI and Moving Averages Mean for a Dogecoin Entry
The 14-day RSI stands at 54.0, just above the neutral 50 line and far from both the oversold threshold of 30 and the overbought threshold of 70. Momentum has turned mildly positive, but the market is neither capitulating nor overheated. Anyone waiting for an oversold entry trigger does not have one at this price.
 FOMO FamilySponsored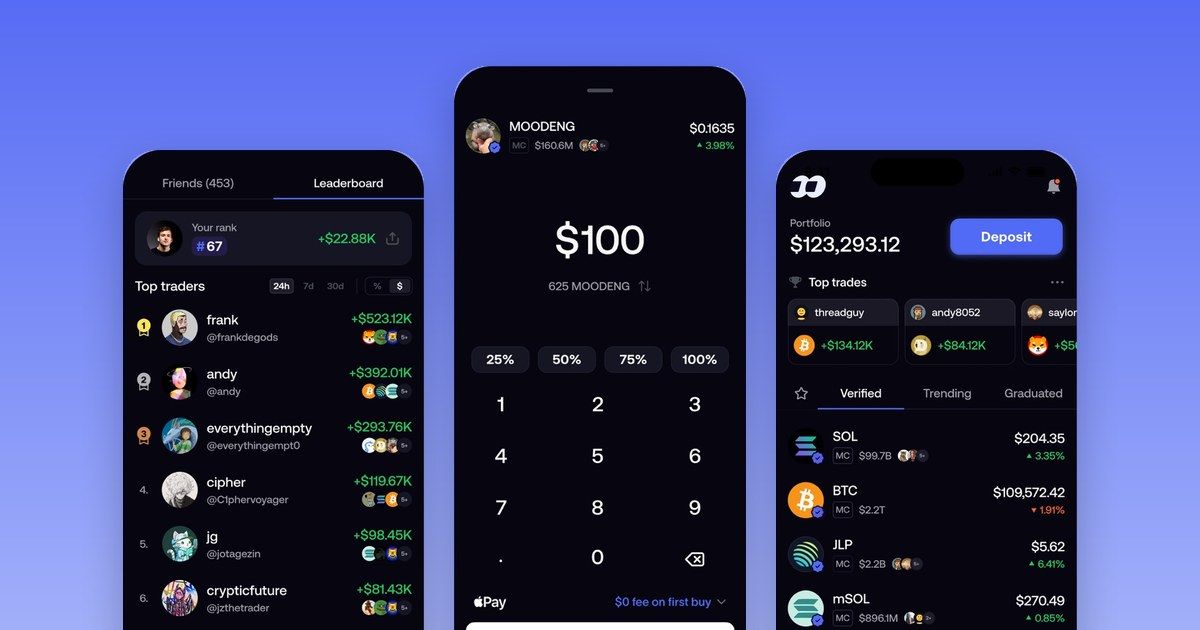
Buy meme tokens straight from your phone
We used FOMO Family ourselves and bought meme tokens with it, Robinhood Chain included. Deposit, find the token, buy: it takes seconds. Our link gets you ten percent off the fees.
Get the app and 10% off fees →Memecoins are high risk, a total loss is possible. Partner link.
The moving averages tell the more useful story. The 50-day EMA at 0.0878 US dollars still sits 6.7 percent below the 200-day EMA at 0.0940 US dollars, the classic configuration of an established downtrend, but the gap is closing. Reversing it requires the shorter average to keep rising and cross the longer, which takes weeks of sustained buying. The simple averages are already level: the 200-day SMA stands at 0.0878 US dollars and the 50-day SMA at 0.0875 US dollars.
For an entry decision the technical picture offers no confirmation in either direction. Buying here means buying into an unfinished trend change, which is defensible on a long horizon with a defined position size and poor for anyone expecting a quick move.
What Trading Volume Reveals About Demand for Dogecoin
Turnover over the past 24 hours amounts to roughly 383 million US dollars. Average daily volume over the past 30 days is about 969 million US dollars, against about 706 million across the past 90 days. Demand this month runs around 37 percent above the level of the preceding quarter.
That recovery in turnover is the most important change since the summer. A slow slide on thin volume can continue far longer than a sell-off on heavy volume, because what is missing is the other side of the trade. Dogecoin was in that condition in August and is no longer: buyers have returned, and the price moved with them. The caveat is the last week, in which the daily average fell back to about 787 million US dollars.
Thin volume also shows up in the price paid: the spread widens and larger orders move the market against the buyer.
The backdrop fits. The CoinMarketCap Fear and Greed Index reads 67 out of 100 on 4 October 2026, in the greed range, and speculative assets of this kind tend to move with that sentiment rather than ahead of it.
Structural Factors: What Speaks for Dogecoin and What Its Supply Mechanics Hold Against It
Dogecoin has no supply cap. The protocol issues 10,000 DOGE per block at a block time of roughly one minute, adding about 5.26 billion new DOGE each year. Against the circulating supply of 156.2 billion coins, that is an annual expansion of roughly 3.4 percent. The rules are documented on the official Dogecoin project site.
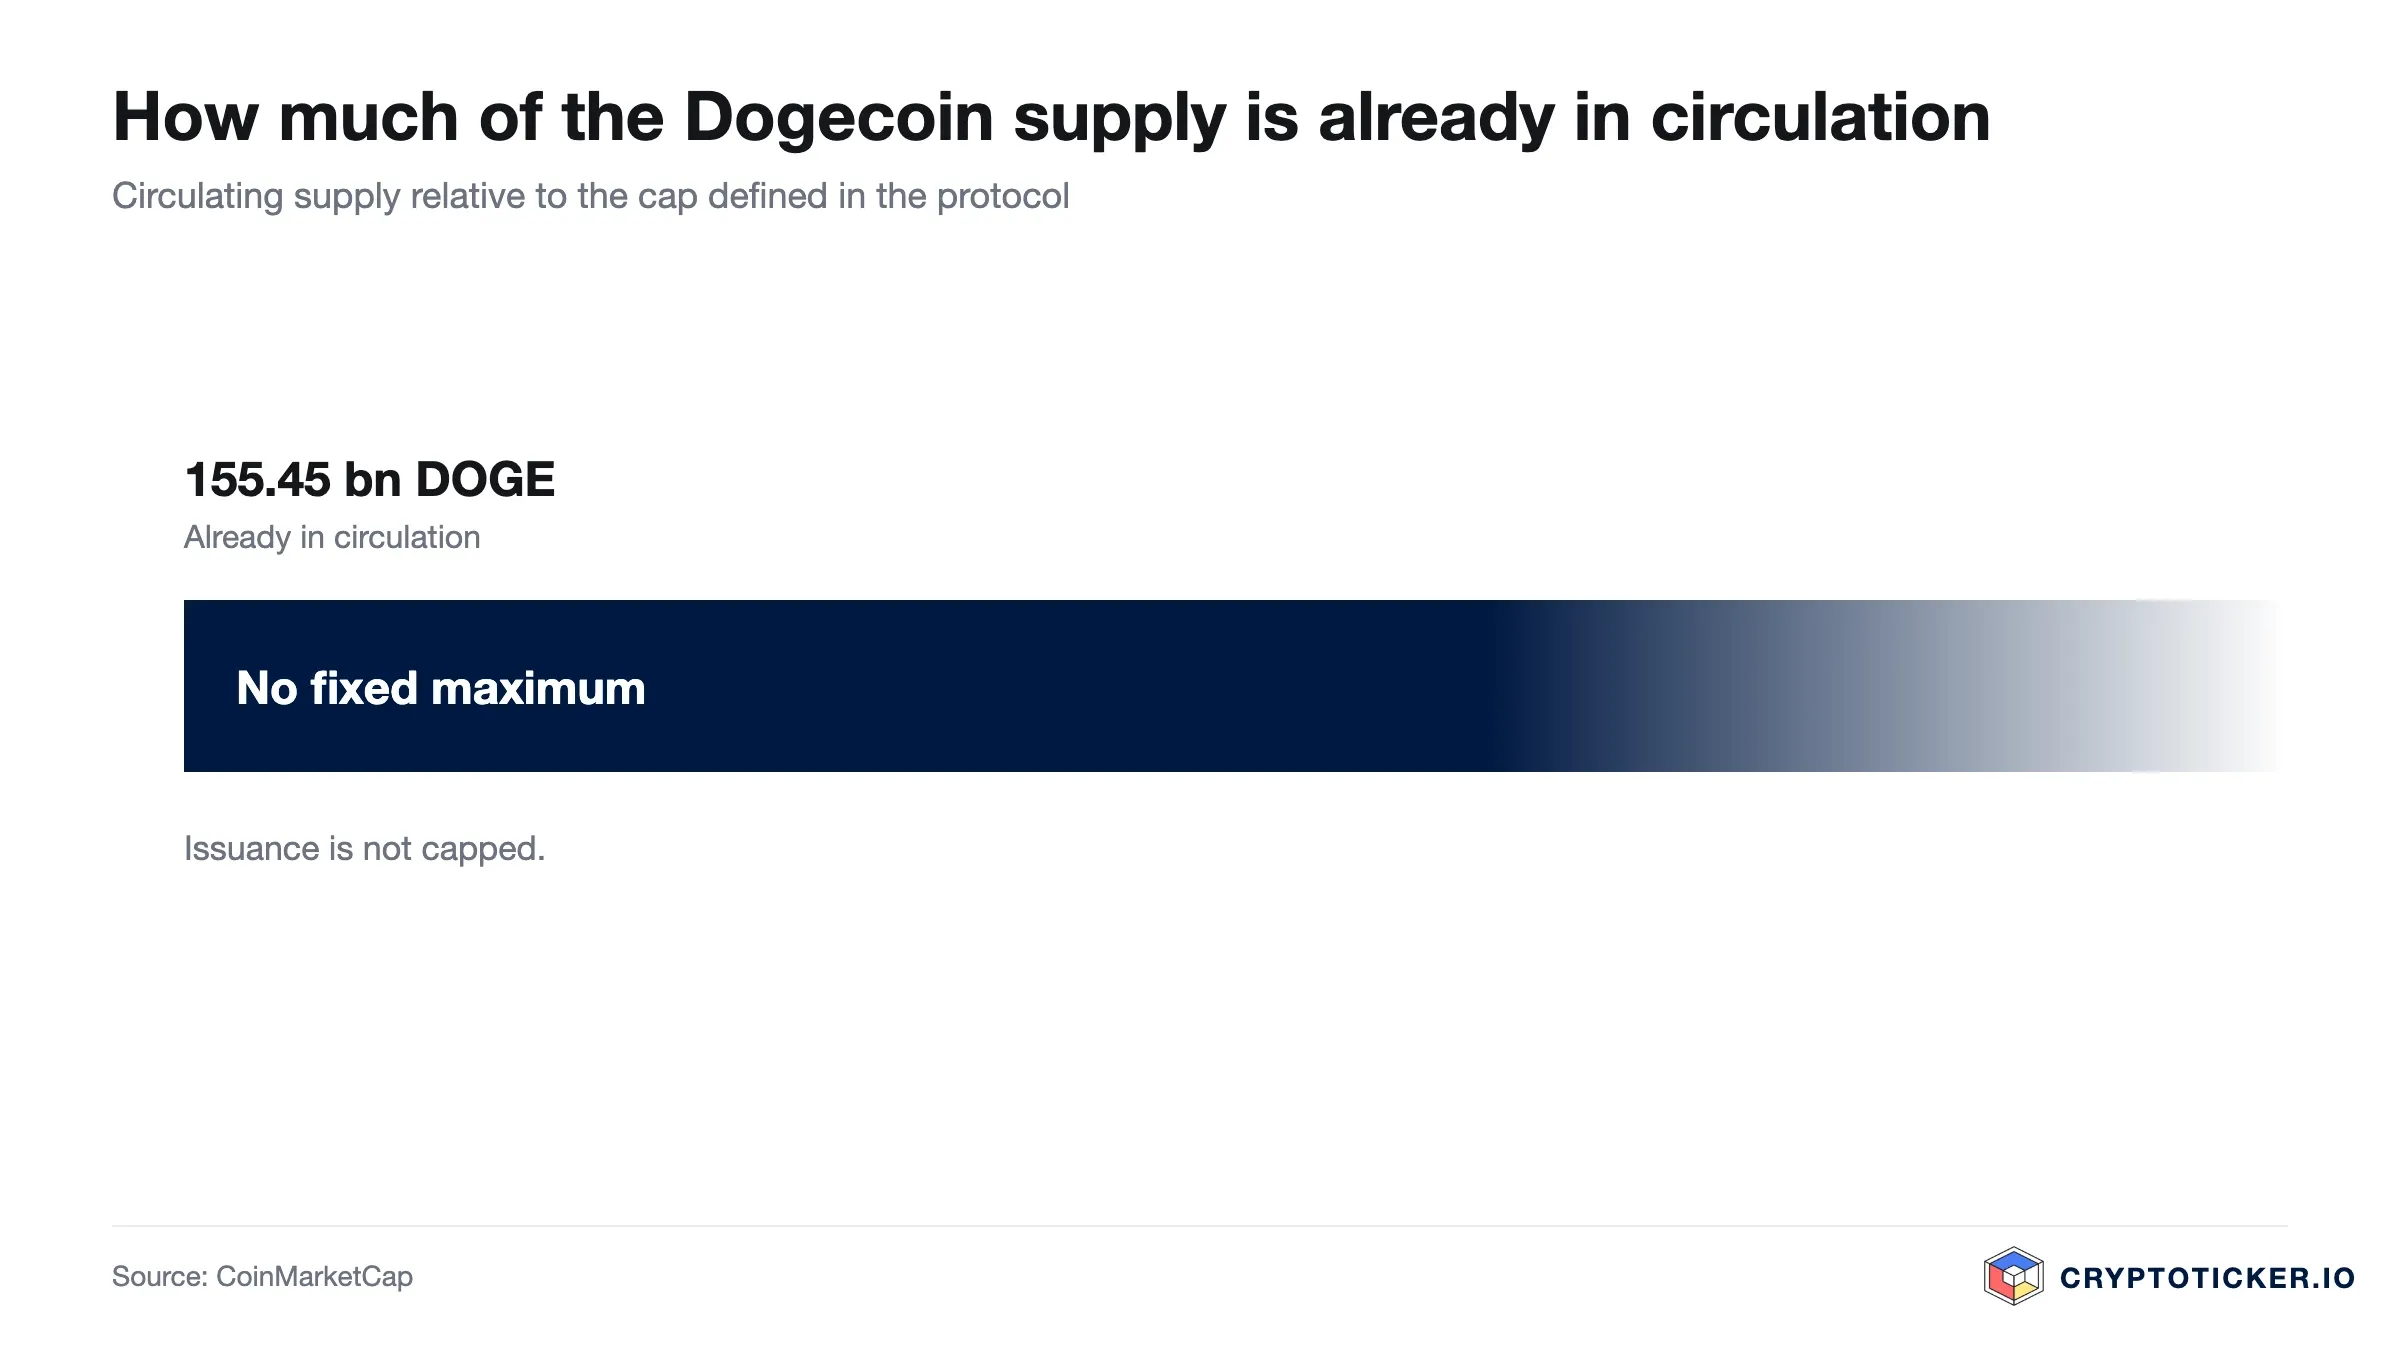
The effect is structural rather than dramatic. Dogecoin needs a steady inflow of demand simply to hold its price, because the circulating supply grows every year. In a strong market that headwind is barely noticeable; in a weak one it compounds the drift.
On the other side of the ledger sits distribution. Dogecoin is listed on effectively every significant exchange and holds one of the widest retail holder bases in the sector. When speculative appetite returns, capital can flow into DOGE without friction, which is one reason the coin has historically moved early in recovery phases.
Utility is where the case is thinnest. Dogecoin works reliably as a fast and cheap payment network, but it has no developing application layer and no fee mechanism tying usage to the value of the coin. Its price is driven almost entirely by speculative demand, which explains both the depth of this decline and the speed of past advances.
Regulation has moved in the coin's favour. Under the European MiCA framework, supervised by the European Securities and Markets Authority, established crypto assets can be offered by licensed providers under harmonised EU rules. That lowers the regulatory risk of holding DOGE through a licensed venue, though it says nothing about the price.
Three Arguments For Buying Dogecoin at Current Prices
The entry level is still in the lower half of the year's range. At 0.0930 US dollars the price sits 34.8 percent above the twelve-month low of 0.0690 US dollars and 65.1 percent below the twelve-month high of 0.2668 US dollars. That is no longer the bottom of the range, and it is a long way from the top of it.
The decline has reversed. A 90-day gain of 21.5 percent and a 30-day gain of 9.7 percent stand against a seven-day loss of 3.9 percent. Selling pressure has gone, which is a precondition for a trend change without being proof of one.
Liquidity and reach remain intact. Dogecoin is the twelfth largest crypto asset by market value at roughly 14.5 billion US dollars. Positions can be entered and exited at any time on regulated venues, which is not true of every asset that has fallen this far.
Three Arguments Against Buying Dogecoin at Current Prices
The downtrend is technically unbroken. The price trades above the 50-day EMA at 0.0878 US dollars but still below the 200-day EMA at 0.0940 US dollars, and the shorter average remains the lower of the two. Until that order reverses, the medium-term trend is still down.
The latest week has thinned out. Seven-day average volume of about 787 million US dollars runs 18.8 percent below the 30-day average of about 969 million. A recovery whose turnover starts shrinking tends to lose its momentum first and its recovered levels second.
The supply grows without limit. Roughly 5.26 billion new DOGE enter circulation each year, an expansion of about 3.4 percent. Absent growing demand, that alone exerts continuous downward pressure on the price.
How to Buy Dogecoin at Current Prices: Costs, Custody, Providers
Two cost blocks determine the outcome of a purchase: the trading fee and the spread. In a thin market the spread weighs more heavily, because it is embedded in the price rather than itemised. The figure worth comparing is the total paid for a given quantity of DOGE.
Which venue is appropriate depends on how much weight an investor places on regulation and asset protection. Our crypto exchange comparison sets out the terms side by side, and for those who prioritise European authorisation, the overview of regulated exchanges under MiCA is the more relevant starting point. Detailed accounts of individual providers are available in our Kraken reviews and Bitpanda reviews.
On custody the rule of thumb is simple. For smaller amounts, holding at a regulated exchange is practical. For a position intended to be held over years, the coins belong in a wallet the investor controls, and for larger sums on a dedicated device. Our hardware wallet comparison covers the models we consider suitable.
One note on execution: given the reduced depth described above, a single large market order is the most expensive way in. Limit or split orders reduce the slippage thin books produce.
So Is Dogecoin a Good Buy at Current Prices? Short Term and Long Term
For the short term the data no longer argues against an entry, but it does not yet argue for one either. The price trades above the 50-day average and 1.0 percent below the 200-day, the RSI at 54.0 gives no signal, and monthly volume is back at normal levels while the last week has thinned. Whoever buys on this horizon is betting that the 200-day line falls.
For the long term the assessment turns on whether speculative demand in this segment holds. If it does, Dogecoin's reach and liquidity leave it positioned to participate, and an entry in the lower half of the annual range is a defensible starting point. If it does not, annual supply growth of 3.4 percent works against the price indefinitely, and the coin has no fee or utility mechanism to fall back on.
This is an assessment of the data, not a recommendation to buy or sell. The assumption set out here in August, that the 0.0690 to 0.0750 US dollar zone would hold, has since been confirmed and overtaken. The assumption behind the constructive case is now that the 50-day EMA at 0.0878 US dollars holds as support; it should be treated as refuted if the price closes below that line, or if the 30-day average volume falls back towards the summer level. The assumption behind the cautious case should be treated as refuted if Dogecoin closes a week above the 200-day EMA at 0.0940 US dollars on rising turnover.
Buying Dogecoin: what to take away
- The price of 0.0930 US dollars sits 34.8 percent above the twelve-month low of 0.0690 US dollars and 65.1 percent below the twelve-month high of 0.2668 US dollars, with the 50-day EMA at 0.0878 US dollars below the market and the 200-day EMA at 0.0940 US dollars just above it. The longer-term view is set out in our Dogecoin price prediction.
- Volume is the swing factor: a 30-day average of about 969 million US dollars against a 90-day average of about 706 million points to returning participation, while the last seven days at about 787 million point the other way. Where a position can be entered at a reasonable spread is covered in our crypto exchange comparison.
- Custody belongs settled before a position is added to, because unlimited supply and thin liquidity make DOGE a long-horizon holding rather than a short trade. Suitable devices are listed in our hardware wallet comparison.
Disclosure: Some of the providers mentioned in this article work with us through partner programmes. This has no influence on the price analysis or on our assessment of the chart situation; the price data comes from a public market data source and can be verified there.
(As of 4 October 2026. This article is not investment advice. Prices, fees and terms change; check them with the provider before every purchase. Crypto assets are subject to high price volatility, and a total loss is possible.)
Transparency note: This article was produced with the assistance of artificial intelligence and reviewed by our editorial team before publication. All figures and claims were checked against the primary sources linked in the text. The feature image was generated with AI.
Which topics should we dive deeper into?
Select what genuinely interests you. Your picks feed directly into our editorial planning.
Crypto news that's actually worth your time.
Weekly. 60 seconds. Carefully curated by our editors: no hype, no promo flood, no spam.
More from CryptoTicker