
Bitcoin price at $76,887: BTC slips to its 100-day line on US election day
Bitcoin falls to its 100-day average of around $76,540 on the morning of the US election and briefly trades below it for the first time since August. For German buyers from November 2025, the one-year holding period ends at the same time, with consequences for offsetting losses.





Which topics should we dive deeper into?
Select what genuinely interests you. Your picks feed directly into our editorial planning.
Crypto news that's actually worth your time.
Weekly. 60 seconds. Carefully curated by our editors: no hype, no promo flood, no spam.
What the data shows: on Tuesday morning bitcoin trades only 0.45 percent above its 100-day average, and at the intraday low it briefly slipped below it for the first time since mid-August. Our view follows further down. The brief dip below the line matters less than whether a daily close below it follows, and that close falls on the night of the US election.
Bitcoin costs $76,887 at 05:47 CET on Tuesday, November 3, or 68,720 euros. That is 1.95 percent less than 24 hours earlier, according to CoinGecko. The range over the past day runs from $76,498 to $78,374, and bitcoin worth $26.7 billion changed hands.
Bitcoin price on Tuesday morning: an intraday low just below the 100-day line
The overnight decline is small on its own. Bitcoin has given up 3.6 percent over the past seven days and 9.4 percent over 30 days. What stands out is where the price now sits. By our own calculation from CoinGecko daily data, the average of the last 100 daily closes is around $76,540. The intraday low of $76,498 was therefore a little more than $40 below it, while the current price is just under $350 above.
Other calculations arrive at almost the same figure. Depending on the data source and closing time, the line sits between $76,500 and $76,550. That spread does not change the picture: at a price of $76,887 the line is less than half a percent away in every case.
What the 100-day moving average measures and why traders watch it
A moving average is the mean of closing prices over a fixed number of past days, shifted forward by one day each day. The 100-day line therefore covers a little over three months. It reacts more slowly than the 20-day or 50-day line and faster than the widely quoted 200-day line. Many traders read it as the boundary of the medium-term trend. As long as the price closes above it, the move since the summer is considered intact.
The line only has an effect because many market participants watch it. Buy orders often cluster just above it, hedges and stop orders just below. A stop-loss is an order that automatically sells a position once a set price is reached. If the price falls through such a zone, these orders can accelerate the move. If buyers hold, a rebound often follows. The line guarantees neither outcome.
Above it since August 18: the history of the line
According to our analysis, the last daily close below the 100-day average came on August 18. Bitcoin closed at around $64,700 that day, with the line at $66,400. Then the rally began that carried the price to around $86,600 by September 21, the high of the past six months.
Since that high, bitcoin has lost a little more than 11 percent. At the same time the average itself has risen, because the weak summer prices are gradually dropping out of the calculation window. At the end of September the line was still around $70,100, in mid-October $73,500, and today $76,540. Price and line have moved towards each other from both sides. That is why the gap is so small today, even though the price did not collapse last week.

 Find an exchange with limit orders for your BTC
50, 100 and 200 days: where the moving averages stand now
The 100-day line is not the only level nearby. Our calculation from CoinGecko daily data gives the following picture: the 20-day average is around $80,530 and the 50-day average around $81,930. Bitcoin broke below both at the end of October. The simple 200-day average sits well below at around $73,160.
The chart below shows the exponentially weighted averages, which give more weight to recent prices. Based on CoinMarketCap data, the exponential 200-day line is around $76,310, almost level with the simple 100-day average. Two methods, one zone: between $76,300 and $76,550 the two lines that traders use for the medium-term trend meet.
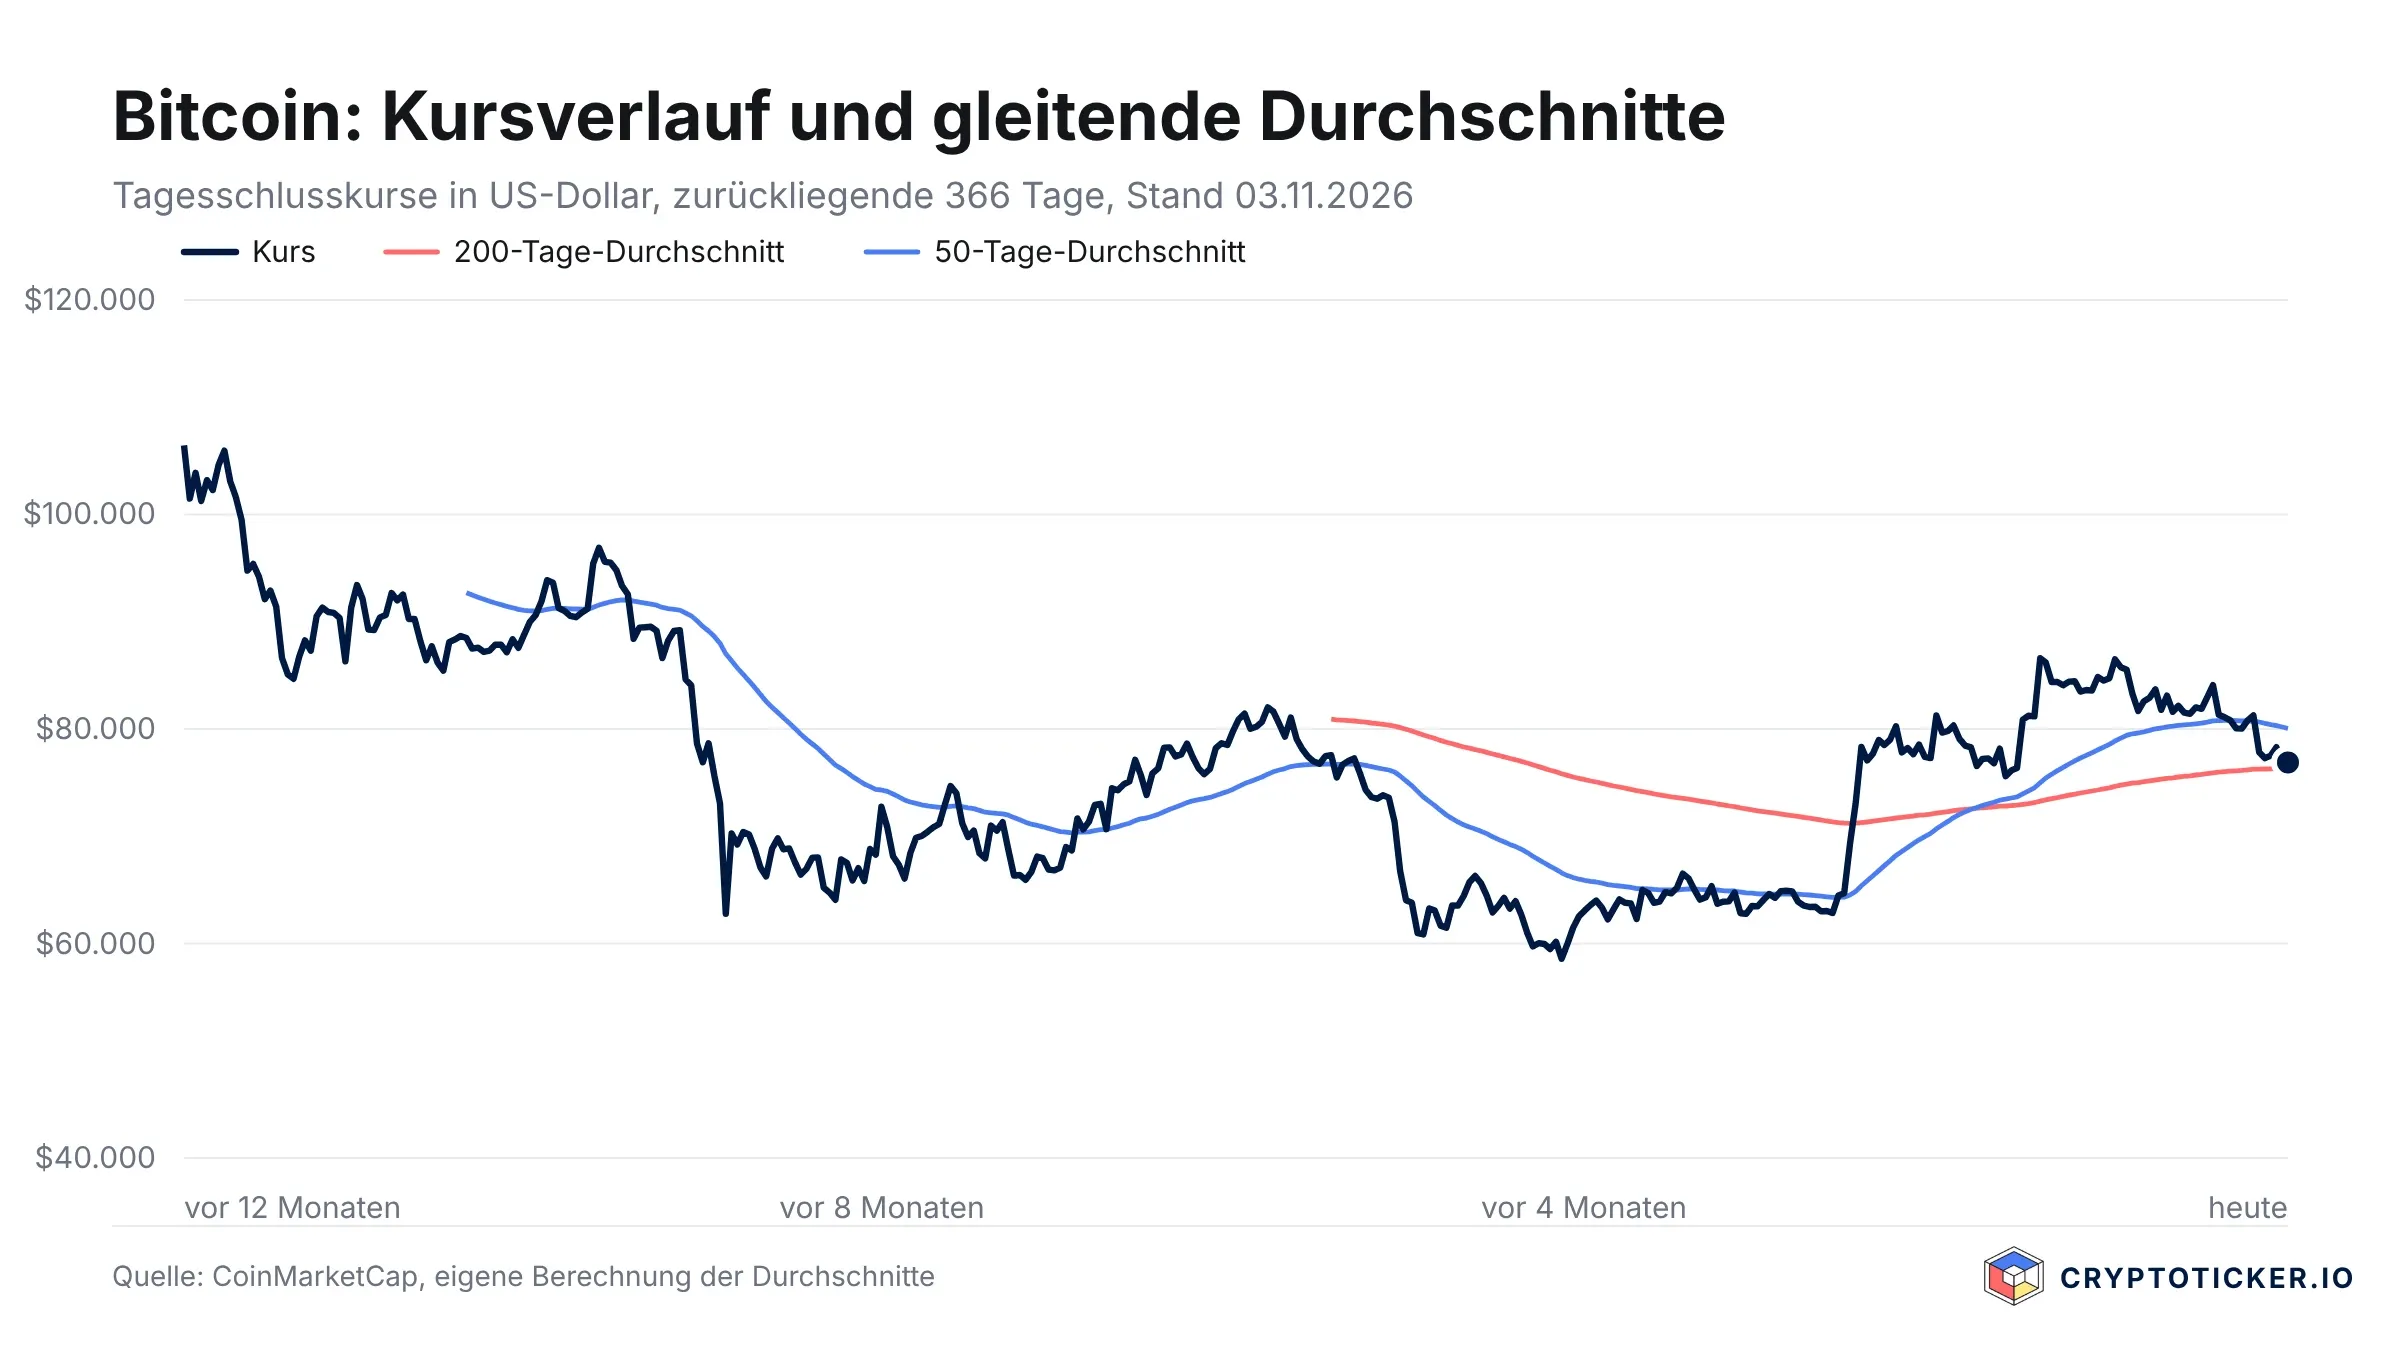
Since Monday's price report: $1,556 lower
On Monday morning bitcoin stood at $78,443. Our price report on October's ETF flows had described the $78,000 level as short-term support, with the price $443 above it at the time. That level did not hold. Since then the price has fallen by $1,556, or 2.0 percent, and the debate has shifted from $78,000 to the zone around $76,500.
The follow-up test in US spot ETFs is still open. On Friday, October 30, $643.3 million flowed out of them, the largest daily outflow since the end of June. On Tuesday morning the Farside Investors table showed only part of the funds for Monday, so Monday cannot yet be read as a reversal or a continuation. What is new since Monday is the date that now overshadows all others: the US election.
US midterms on Tuesday: why election night falls on the European morning
Today the US votes on every seat in the House of Representatives and on about a third of the Senate. Polling stations close on Tuesday evening local time, which is between midnight and early Wednesday morning in Central Europe. The first reliable results will therefore arrive during hours when hardly anyone in Germany is trading, while the crypto market runs around the clock.
For crypto, regulation is what is mainly on the ballot. The majorities in Congress will decide whether a new market structure law for digital assets has a chance next year. The outcomes we have modelled for bitcoin, XRP and Solana are in our five scenarios for the US midterms. For the price on Wednesday morning, something simpler counts first: an election night brings movement in thin trading, and thin trading reacts more strongly to large orders.
 Track your holding periods with a tax tool
Fear & Greed at 26: sentiment turned within five days
The Crypto Fear & Greed Index from Alternative.me measures crypto market sentiment on a scale from 0 (extreme fear) to 100 (extreme greed). It stands at 26 on Tuesday, in fear territory. On October 29 it was still at 51, which is neutral. In between came Friday's outflow, the drop back below $78,000 and caution ahead of the election.
A reading of 26 is not an extreme. On this scale, extreme fear starts below 25. Sentiment is subdued but not panicked, and that fits the chart: the price is giving way without any visible sell-off.
One-year holding period: November 2025 buyers are about 28 percent down
For investors in Germany, today also has a tax angle. Gains from selling bitcoin are tax-free under Section 23 of the German Income Tax Act if more than one year passes between purchase and sale. Within this holding period they are taxable once all private capital gains in a year reach the exemption limit of 1,000 euros. Our overview of the crypto holding period reform summarises where the planned change stands.
A year ago, in early November 2025, bitcoin traded at around $106,000. Anyone who bought then is about 28 percent down in dollar terms today, and the holding period for those purchases is expiring right now. That has a consequence that is often overlooked: a loss realised within the holding period can be offset against gains from other private sales. Once the period has expired, it no longer counts for tax purposes.
What matters are the euro values at the time of purchase and sale and, with several purchases, the order in which holdings are treated as sold. Whether selling before the deadline makes sense depends on your other gains and is a question for a tax adviser. Either way, you should know the purchase date of every single position. A crypto tax tool shows it for each exchange and wallet.
Bitcoin levels to the upside and downside
To the downside, the zone between $76,300 and $76,550 is the first level, formed by the simple 100-day average and the exponential 200-day line. Below that, the simple 200-day average sits at around $73,160. A daily close below the first zone would be the first since August 18.
To the upside, bitcoin first has to reclaim the $78,000 level that still held on Monday; the high of the past 24 hours was $78,374. Above that come the 20-day average at around $80,530 and the 50-day average at around $81,930. Only above this range would the decline since the end of October be recovered.
If you want to buy or sell on a night with large expected swings, a limit order works better than a market order. A limit order is only filled at the stated price or better, which protects you from a poor fill in thin trading. Almost all regulated crypto exchanges offer this order type, some with lower fees than for market orders.
Our view on the 100-day line
In our editorial view, a test of the zone is more likely than a quick recovery of $78,000. Three documented points support this: the $643.3 million outflow from US ETFs on Friday, the drop in the Fear & Greed Index from 51 to 26 within five days, and the loss of the 20-day and 50-day lines at the end of October. Against it, the move has been orderly so far: no daily loss of more than three percent, volume of $26.7 billion without outliers, and sentiment that is not yet in extreme territory.
None of this is a recommendation to buy or sell. The weekly close says more than a single dip below the line on election night. Bitcoin remains a highly volatile asset, and a total loss is possible.
100-day line: below $76,540 the daily close counts
- Wait for the daily close: A brief dip below $76,540 on election night is not yet a trend break. If you want to add to your position, you can do so in fixed instalments through a bitcoin savings plan instead of hunting for the one right moment.
- Check purchase dates: For positions from November 2025, the holding period is ending now. A tax tool shows which holdings are still within the period.
- Place orders with a limit: In thin overnight trading, a limit order protects against outliers. You will find the providers' order types and fees in the exchange comparison.
(As of November 3, 2026. This article is not investment advice. Prices and fee structures change; check the terms with the provider before you buy.)
Frequently asked questions about bitcoin's 100-day line
Transparency note: This article was produced with the assistance of artificial intelligence and reviewed by our editorial team before publication. All figures and claims were checked against the primary sources linked in the text. The feature image was generated with AI.
Related articles
- Bitcoin Golden Cross: What Twelve Signals Since 2014 Really Show
- Bitcoin price prediction: $295 above the 100-day line, the level that decides
- Bitcoin at $79,978: what to watch at the lowest level since September
- Cardano at a three-month high, the golden cross fell on October 1: the last one ended 42.4 percent lower
- 117.32 dollars under the Solana price, Alpenglow still without a date: the level that decides
Which topics should we dive deeper into?
Select what genuinely interests you. Your picks feed directly into our editorial planning.
Crypto news that's actually worth your time.
Weekly. 60 seconds. Carefully curated by our editors: no hype, no promo flood, no spam.

October 4, 2026 10:14 AM

Dogecoin price at $0.0929: why the 200-day line sits at $0.0878 and not at $0.093
Dogecoin trades at $0.0929 on Sunday morning. Market reports put the 200-day line at around $0.093; recalculated from 366 daily closes it sits at $0.0878. Two October dates that matter for investors in Germany run alongside it.
October 23, 2026 10:23 AM

XRP price prediction: the 100-day average crosses the 200-day average, 6.05 billion XRP move onto exchanges: what matters now
Our reading: on October 21 XRP's 100-day moving average rose above its 200-day average, the first time in our measurable series since May 11. Over the same stretch exchanges took in 6.05 billion XRP, and the two numbers point in different directions.
October 20, 2026 7:29 AM

Bitcoin price at $81,993 and a third narrow daily range in a row: will the $81,481 level hold?
Bitcoin stands at $81,993 on Tuesday morning, wedged between the 50-day line at $81,481 and the 20-day line at $83,242. Three daily ranges in a row came in below the 90-day median, and 3,624 Bitcoin in options expire at 8am UTC.
October 29, 2026 9:33 AM

Bitcoin Cash falls below $286: the 200-day line that decides the trend
Bitcoin Cash loses almost 6 percent to $279.87 and slips below its 200-day line at $286.19. The trigger is the Fed rate pause of October 28, at which two members even voted for an increase.
October 24, 2026 7:25 AM

Why bitcoin at $80,806 slipped below its 50-day line after 66 days: what matters now
Analysis: the bitcoin price stands at $80,806 on Saturday morning, 1.23 percent below its 50-day moving average of $81,807, which it had held for 66 days. What the four moving averages, the ETF outflows and the mining difficulty adjustment on October 29 mean for the coming trading days.
October 19, 2026 7:22 AM

Bitcoin price at $82,769 after two days on a third of the turnover: the level that decides
Bitcoin opens the week at $82,769, 1.6 percent above Friday's close. The gain was built over two days running on a good third of the usual turnover, and that is exactly why the level at $81,501 now decides.

November 2, 2026 7:30 PM

Chainlink slips below its 100-day line as long bets shrink by a third
Analysis: Chainlink trades at $11.11 and falls below its 100-day line at $11.36. At OKX the long-short ratio has dropped from 3.18 to 2.10 since October 24, and the 200-day line sits at $10.03.
October 21, 2026 7:19 AM

ETF inflows of $526.7 million meet a Bitcoin price of $82,708: the levels that decide before the Fed meeting
Bitcoin costs $82,708 on Wednesday morning after $526.7 million flowed into the US spot ETFs on Monday. October still leaves those funds in the red, and two moving averages frame the market until the Fed meets on October 28.

August 28, 2024 6:12 PM

Breaking News: Will This Volatile Summer End With Bullish Signs For Bitcoin Price?
Bitcoin price summer volatility continues! Will it break out or fall further? Get expert analysis, key levels to watch, and industry leader predictions.
October 25, 2026 6:19 AM

Bitcoin Price $80,853: The Fed Statement Comes at 7 p.m. German Time This Week
Germany moved its clocks to winter time last night, the United States does not follow until November 1. For one week every US date shifts forward by an hour, and this is the week that carries the rate decision on Wednesday and the options expiry on Friday.
October 22, 2026 7:24 AM

Bitcoin price $82,690 after the drop from $84,808: outperforms the market
Analysis: Bitcoin trades at $82,690 on Thursday morning, $18 below yesterday's reading, even though the price had run up to $84,808 overnight. Total market capitalisation lost 2.64 percent over the same period, and Bitcoin dominance rose to 59.53 percent.
October 14, 2026 4:27 PM

Bitcoin price 25 percent below its level a year ago: what you can do now
A year ago one Bitcoin cost 99,310 euros, today it is 74,239 euros. For the October 2025 vintage the speculative period now expires, and that changes the calculation behind every sale.
May 13, 2026 6:52 PM

Why Did Bitcoin Price Crash below 80k Today?
The crypto market is in turmoil as Bitcoin and Ethereum lose critical support levels. What triggered the sudden price collapse?
January 9, 2025 3:30 PM

2025 Bitcoin Price Prediction: What if BTC Price breaks below $90K Support?
The 2025 Bitcoin price prediction hinges on its critical $90,000 support level. Will it hold, or could we see declines to lower levels? Explore key insights shaping the short-term Bitcoin trajectory.
October 27, 2026 6:15 PM

Dogecoin price 13.9 percent below the 200-day average: a wider gap on 94 of 166 days
Where things stand: Dogecoin trades at $0.0778 on Tuesday afternoon, 13.9 percent below its 200-day average and 7.4 percent below its 50-day average. What the levels allow, and how often the gap was wider this year.
June 25, 2024 6:26 PM

Solana Price Prediction: Will SOL Surpass 200$?
Why Solana, Shiba Inu, and Cardano are poised for a major rebound, according to the latest market analysis. Can Solana capitalize on the buy signals and reach a new price target?
December 12, 2024 11:28 AM

Bitcoin Hits $100K Again – But a Crash to $60K Might Be Next
Bitcoin is back at $100K after dropping to $94K, but concerns are growing as BTC faces strong resistance at $104K. Will the bullrun continue, or is a major crash coming in January?
August 30, 2026 1:32 PM

Bitcoin Price Correction: Why BTC Stalled Dead at $78,000 Again
Bitcoin corrected from $81,455 after a hawkish Fed. The chart shows the exact same rejection level as May. Here are the upside and downside targets.

August 20, 2026 4:24 PM

Bitcoin Across Multiple Wallets: How Austria Works Out the Acquisition Cost
Bitcoin spread across several wallets? How Austria works out the acquisition cost and the rolling average price for tax purposes.
July 1, 2024 9:20 AM

Bitcoin News Today: Why Is Bitcoin Price Up Starting July?
Starting July, recent market movements, political debates, and court rulings are shaping the future of Bitcoin and the broader crypto market. Here are the latest insights and analysis...
September 24, 2026 10:38 AM

Fed Rate Hike in October: What to Check on Leverage, Liquidation and Holding Period After the PMI Jump
The flash US purchasing managers' index has jumped to 58.4 points, its highest level since July 2021, and input prices are rising at a pace last seen in October 2022. The futures market now prices a further Fed rate hike on October 28 at almost 70 percent, and the crypto market is falling broadly.
February 19, 2026 11:26 AM

Crypto News Today: BTC Slips as US-Iran Tensions and Hawkish Fed Spark "Risk-Off"
Bitcoin struggles near $68,000 as US-Iran geopolitical tensions and hawkish Fed minutes rattle investors. Get the latest crypto news today.
September 1, 2024 1:30 PM

Bitcoin Price Prediction: How Will September Unfold For BTC Price?
Bitcoin price is facing significant market volatility, as it hovers around $58,000. What are the key indicators and on-chain data shaping the future of BTC Price, and how will September unfold?
March 8, 2026 7:33 PM

Bitcoin Price Prediction: Can BTC Recover After the Drop to $66K?
Bitcoin trades near $66K after a sharp correction. Is BTC preparing for a recovery or could another drop happen first?
October 31, 2026 9:46 AM

Bitcoin Price Crash Continues: BTC Slips Below $78,000, Here Is the Next Target
Bitcoin price crashes below the key $78,000 area as selling pressure builds. We analyze the chart and reveal the next short-term target for BTC.
June 18, 2024 10:15 PM

WHY Is Bitcoin (BTC) DOWN: Top 3 Reasons
Why is Bitcoin (BTC) down, is what everyone is concerned with. After market analysis, here are the top 3 reasons behind it...
October 5, 2026 7:21 PM

Bitcoin price at $85,662 one year after the all-time high: what to watch now
Bitcoin stands at $85,662, which is 32.1 percent below the all-time high whose anniversary falls on October 6. In euros the gap is smaller, and for anyone who bought in October 2025 the one-year tax period is running out at the same time.
More from CryptoTicker